Figures & data
Figure 1. Map showing geographical location of the study area (LPS) in the country
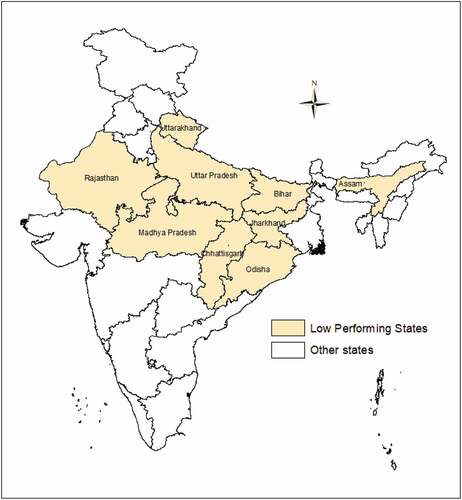
Figure 2. Selection of study participants, NFHS-4 2015–16
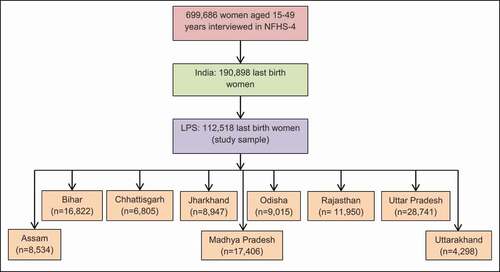
Figure 3. Conceptual framework showing the influence of background and intermediate factors on institutional delivery
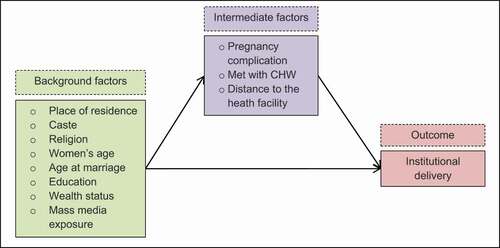
Table 1. Descriptive statistics for the study participants, LPS, NFHS-4 2015–16 (n = 112,518)
Figure 4. Maternal mortality ratio (MMR) in LPS and other India states, SRS 2016–18
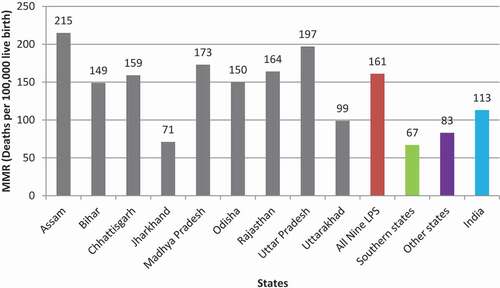
Figure 5. Coverage of institutional delivery (%) across LPS, NFHS-4 2015–16
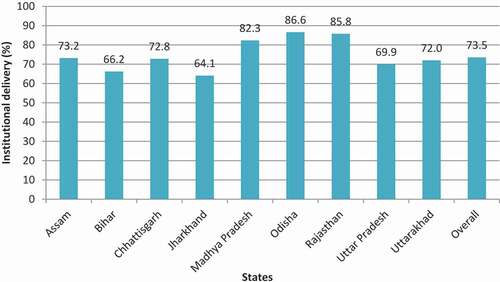
Figure 6. Distribution of institutional delivery (%) by public-private sector across LPS, NFHS-4 2015–16
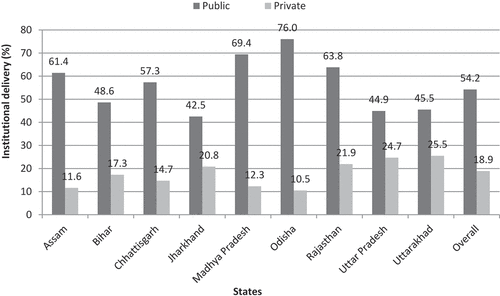
Table 2. Percentage distribution of institutional deliveries by selected characteristics across LPS, NFHS-4 2015–16
Table 3. Multivariate logistic regression models assessing socio-demographic and intermediate factors influencing institutional deliveries across LPS, NFHS-4 2015–16
Table 4. Percentage distribution of reasons for not delivering in a health facility across LPS, NFHS-4 2015–16
Table 5. Perceived distance to the health facility across LPS, NFHS-4 2015–16
Table 6. Interaction models (bivariate and multivariate) assessment to determine the impact of place of residence and distance to the health facility on institutional delivery utilization in LPS, NFHS-4 2015–16
Table 7. The percentage distribution (%) and multivariate logistic analysis assessing the likelihood of JSY scheme utilization by socio-demographic characteristics of women in LPS, NFHS-4 2015–16
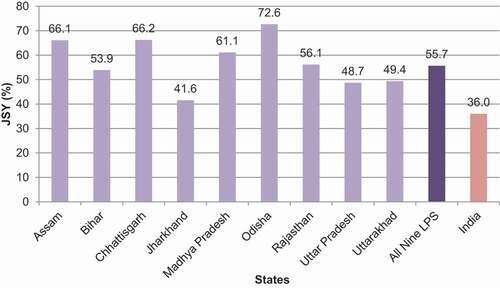
Figure 7. Coverage of JSY scheme (%) across LPS, NFHS-4 2015–16