
Figures & data
Figure 1. Flowchart of the study phases. (PAR = participatory action research, GBD = global burden of disease, PAF = population attributable fraction, VA = verbal autopsy).
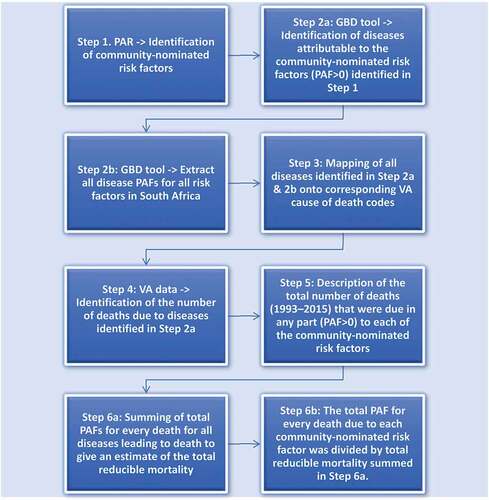
Figure 2. The formula for ‘reducible mortality fraction’: the relative proportion of the PAFs of all risk factors that were due to each and all community-nominated risk factor(s) (example calculation is contained in supplementary material 3). (PAF1 = the PAFs for a community-nominated risk factor for each cause of death multiplied by the number deaths due to that cause, PAF2 = the PAFs for all risk factors for each cause of death multiplied by the number deaths due to that cause, n = 14,430 = the total number of deaths in the population between 1993 and 2015).
Table 1. Summary of all deaths and PAFs in terms of alcohol use, drug use, and unsafe water, sanitation, and handwashing according to sex, age, mortality category, and year of death. (RMF = reducible mortality fraction, IQR = interquartile range, N/A = not applicable)
Figure 3. Proportions of total deaths attributable at least in part to alcohol use, drug use, and unsafe water, sanitation, and handwashing or at least one of those, over time (1993–2015). A death was classified as attributable to each one if the population attributable fraction was >0.
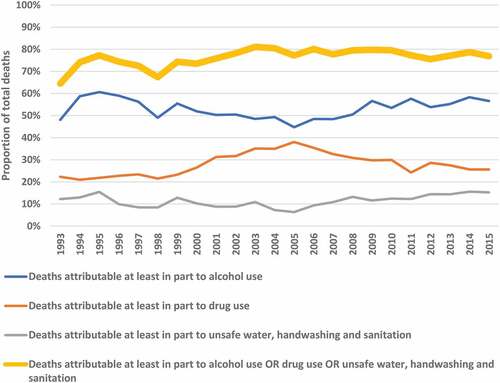
Figure 4. Reducible mortality fractions (RMFs) due to alcohol use, drug use, and unsafe water, sanitation, and handwashing in Agincourt over time (1993–2015).
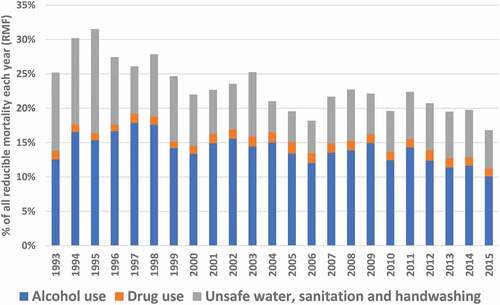
Figure 5. ‘Validation through consensus’: nominating and prioritising risk factors was an iterative collective progressed with sensitive facilitation and sustained engagement/dialogue building [Permissions secured for reproduction of image].
![Figure 5. ‘Validation through consensus’: nominating and prioritising risk factors was an iterative collective progressed with sensitive facilitation and sustained engagement/dialogue building [Permissions secured for reproduction of image].](/cms/asset/05f2f10d-9087-4151-a622-89058d8de35f/zgha_a_2013599_f0005_oc.jpg)