
Figures & data
Figure 1. BMI classes in South Africa, 2017.
Source: Computed from NIDS [Citation37]. Notes: Underweight: < 18.5 BMI; Normal Weight: 18.5–24.9 BMI; Overweight: 25–29.9 BMI; Obese: ≥30 BMI. Age group: ≥15 years.
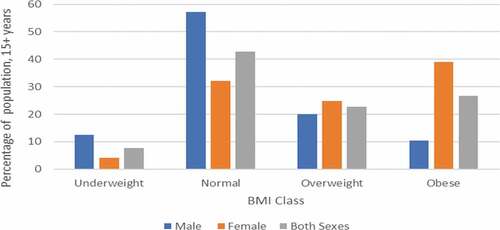
Table 1. Epidemiological data of obesity-related conditions at baseline
Table 2. Relative risk and population attributable fraction for weight-related diseases in South Africa
Table 3. Direct Medical Costs of Treating NCDs and Obesity cost, in million rand (ZAR)
Table 4. Sensitivity analysis for cost of overweight and obesity in 2020, million rand (ZAR)
Supplemental material