
Figures & data
Figure 1. PRISMA flow diagram.
Table 1. Description of the included studies.
Table 2. Glucose changes before and during treatment.
Figure 2. Timelines* for glucose estimation in different studies.
*Will not sum up to 100% since studies used a combination of timelines.
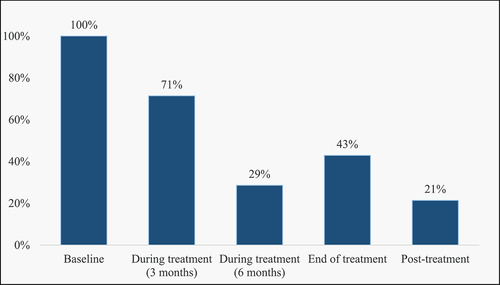
Table 3. Summary of results from the different studies.
Table 4. Summary outcomes in HIV-positive patients receiving TB treatment.
Supplemental material