Figures & data
Figure 1. Virus evolution Genomic spread of SARS CoV 2 VOC.
Source: Nextstrain based on GISAID data: https://nextstrain.org/ncov/gisaid/global?f_region=Africa.
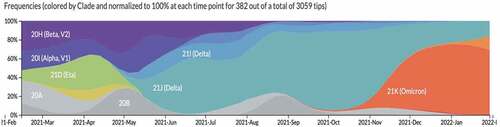
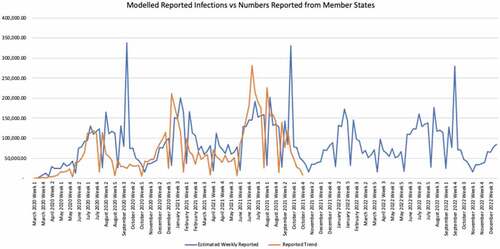
Figure 2. Show predicted scenario 1 at the current level of adhesion to public health measures, rates of contacts, re-infection, variants and immunisation levels; the disease is predicted to remain in the community, though with lower peaks in 2022.
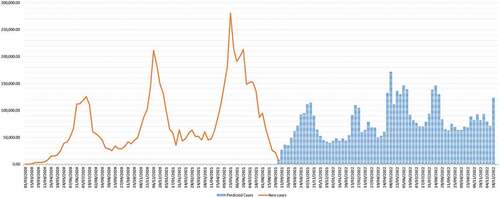
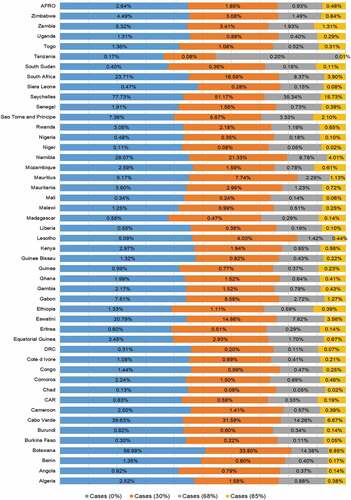
Figure 3. Cases as a percentage of the population at different levels of immunisations at the end of 2022.
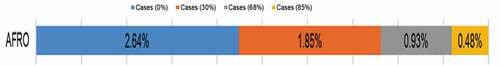
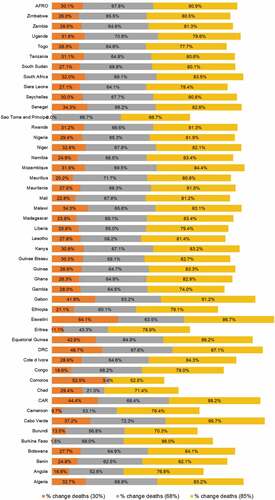
Figure 4. Percentage reduction of deaths among the reported cases with varying levels of immunisations.

Figure 5. Predicted scenario 2 with risk of re-infection at 40%.
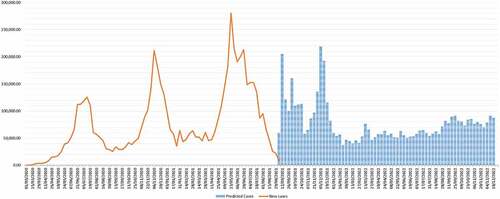
Figure 6. Predicted scenario 2 with risk of re-infection at 80%.
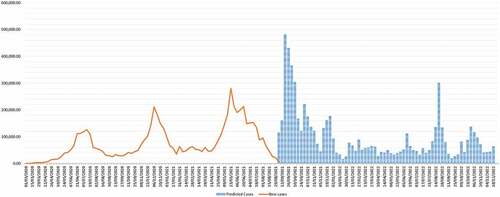
Figure 7. Predicted scenario 3 with the introduction of a new variant.