
Figures & data
Figure 1. Baldwin and Ford’s transfer of training model (1988).
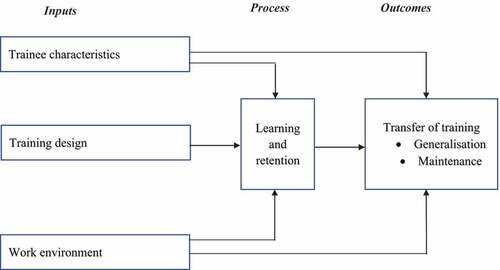
Table 1. Trainees’ baseline characteristics (N = 107).
Table 2. Comparing trainees’ pre- and post-training scores for SRHR self-rated knowledge, SRHR attitudes, SRHR knowledge seeking behaviour and SRHR practices using paired samples t-test (N = 107).
Table 3. Comparing trainees’ delta scores in SRHR self-rated knowledge, SRHR attitudes, SRHR knowledge seeking behaviour and SRHR practices according to their baseline scores by independent samples t-test (N = 107).
Table 4. Association between trainees’ baseline characteristics and changes in SRHR attitudes, SRHR knowledge seeking behaviour and SRHR practices by bivariate linear regression (N = 107).
Table 5. Association between influence of religion, influence of culture and changes in SRHR attitudes, SRHR knowledge seeking behaviour and SRHR practices adjusted for other baseline characteristics by multiple linear regression (N = 107).
Table 6. Association between changes in SRHR self-rated knowledge, changes in SRHR attitudes and changes in SRHR practices adjusted for change in SRHR knowledge seeking behaviour and other covariates by multiple linear regression (N = 107).