
Figures & data
Table 1. Variables.
Figure 1. Locations of study areas.
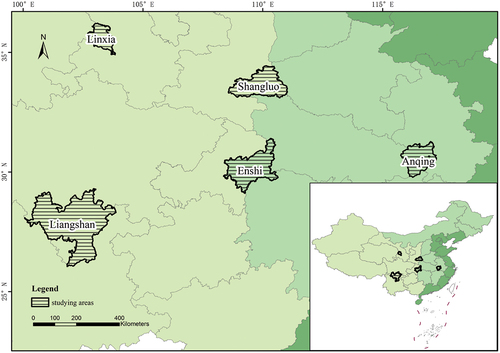
Table 2. Survey data of five Chinese prefectures compared with that of the sixth National health Service survey (%).
Table 3. Vulnerability to poverty by region.
Table 4. Hierarchical linear regression estimation results.
Table 5. The effect of HPAP.
Table 6. Mediating effect model estimation results.