
Figures & data
Table 1. Descriptive statistics on daily mortality and weather conditions in Fuzhou, China, 2016–2021.
Figure 1. The impact of oxidising pollutants on the health of the population. (a) Exposure-response curves for O3, NO2 and Ox on the main causes of mortality in the population. (b) Impact of each 10 μg/m3 increase in O3, NO2 and Ox on the risk of excess mortality in the population (ER values and 95% CI).
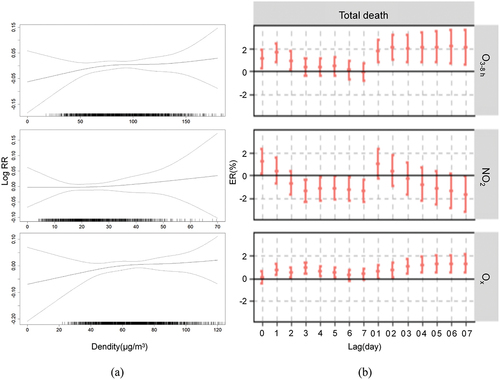
Figure 2. The impact of temperature on the health of the population. (a) 3D maps of the effect of temperature on residential mortality. (b) Contour maps of the effect of temperature on residential mortality. (c) Cross-sectional plot of the impact of heat waves on residential mortality (RR values and 95% CI).
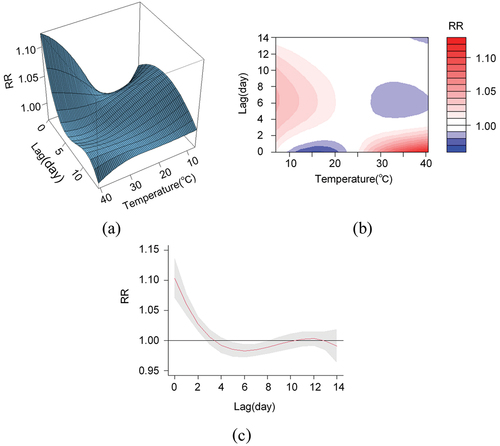
Figure 3. Response to the effects of oxidising pollutants and temperature in major mortality. (a): O3, (b): Ox, (c): NO2.
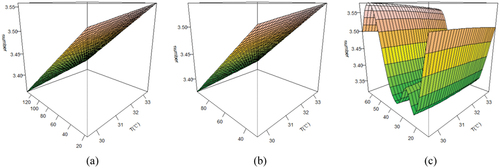
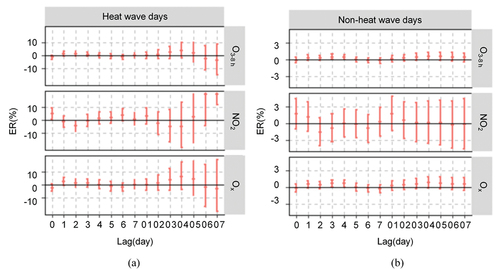
Figure 4. The impact of oxidising pollutants and heat waves on the health of the population. (a) and (b) are excess risk lag distribution of each 10 μg/m3 increase in O3, Ox and NO2 on the excess risk of mortality during heat wave and non-heatwave days, respectively (ER values and 95% CI).
supplements_.docx
Download MS Word (25.7 KB)Data availability statement
Due to the nature of the research, due to ethical supporting data is not available.