
Figures & data
Table 1. Distribution of breastfeeding duration across the characteristics of the study participants.
Figure 1. Distribution of age-for-grade by child’s age at school assessment (Underage = one or more years younger than the expected age for a grade; On-time = at the expected age for a grade or 1 year older than the expected age for a grade; 2 years over-age = 2 years older than the expected age for a grade; and 3+years over-age = 3 or more years older than the expected age for a grade for a grade).
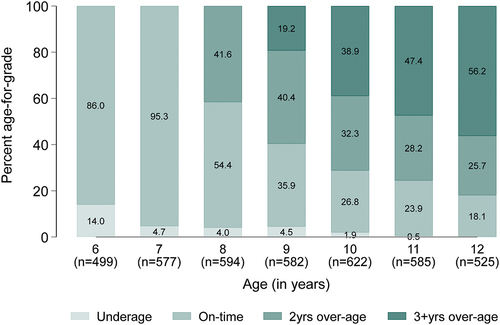
Figure 2. Distribution of age-for-grade at each age by child’s sex (Underage = one or more years younger than the expected age for a grade; On-time = at the expected age for a grade or one year older than the expected age for a grade; 2 years over-age = 2 years older than the expected age for a grade; and 3+years over-age = 3 or more years older than the expected age for a grade for a grade. [M = male F = Female]).
![Figure 2. Distribution of age-for-grade at each age by child’s sex (Underage = one or more years younger than the expected age for a grade; On-time = at the expected age for a grade or one year older than the expected age for a grade; 2 years over-age = 2 years older than the expected age for a grade; and 3+years over-age = 3 or more years older than the expected age for a grade for a grade. [M = male F = Female]).](/cms/asset/aa8488ae-3cc3-483b-a607-850ee032cd1b/zgha_a_2338023_f0002_oc.jpg)
Table 2. Binary logistic regression analysis of the association between duration of breastfeeding and being over-age for grade at one point between ages 10 and 12 in Uganda.
Table 3. Generalised estimating equations analysis of the association between breastfeeding duration and being over-age for grade in primary school among children aged 8–12 in Uganda.