Figures & data
Figure 1. RCCS cohort composition for the cause of death analysis.
Table 1. Characteristics of the study population, and death rates (per 1000 pyo) at different periods (RCCS) - Rakai Community, Uganda (1999 to 2019).
Figure 2. Mortality rates: Age-specific probability of dying between age 15 and 60 - Rakai Community, Uganda (1999 to 2019).
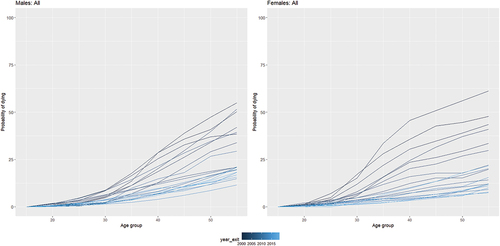
Table 2. Cause-Specific Mortality Rates (per 1000 pyo) in the RCCS – Rakai Community, Uganda (1999 to 2019).
Table 3. Average number of years lived in adulthood (RCCS) - Rakai Community, Uganda (1999 to 2019).
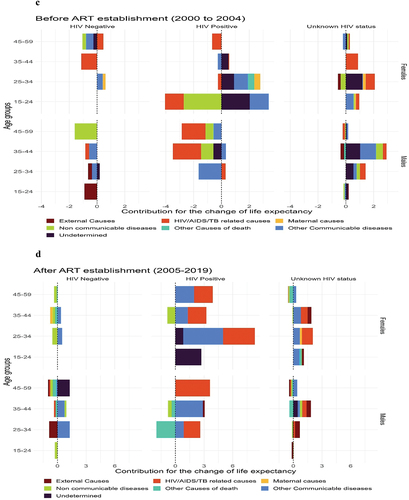
Figure 3. Decomposition of average number of years lived in adulthood, in the entire population (figure 3a) and stratified by HIV status (figure 3b) and by ART establishment periods (figure 3c and figure 3d) - Rakai Community, Uganda (1999 to 2019).
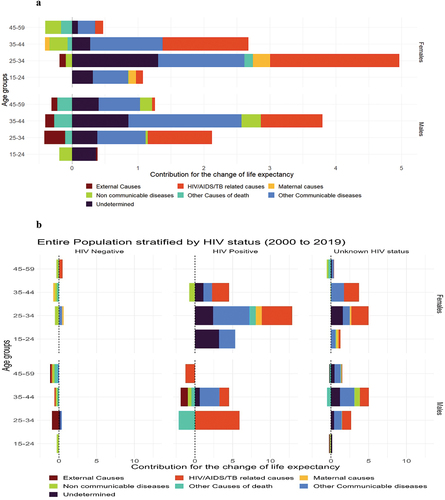
Figure 3. (continued).