
Figures & data
Figure 1. Proportional mortality for children under-5 years according to all-cause mortality rate categories (very high, U5MR greater than 55 deaths per 1000 live births to very low, U5MR less than 5 deaths per 1000 live births). Cause specific mortality is from the child and adolescent cause of death estimation group, 2021(1). Congenital anomalies increase as a proportion of total under-5 mortality as survival improves.
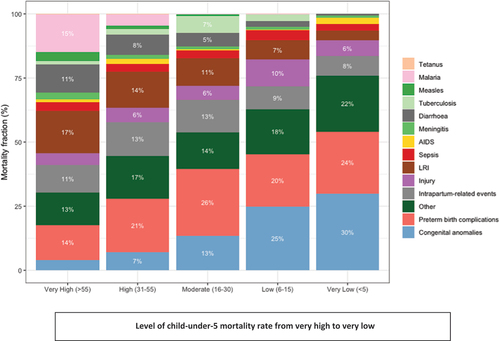
Table 1. Highlights of global reports, conferences, professional association statements and UN resolutions. Many other national advocacy actions have been produced in the last two decades. Collectively, very little result has come from these efforts.
Supplemental material