
Figures & data
Figure 1. PRISMA-ScR flow diagram [Citation14].
![Figure 1. PRISMA-ScR flow diagram [Citation14].](/cms/asset/444df1f7-2ce7-4993-95c5-17bf63adff95/zgha_a_2362310_f0001_oc.jpg)
Figure 2. Geographic distribution of included studies.
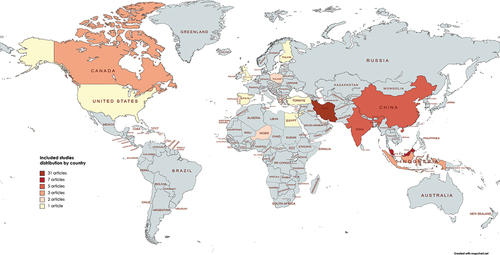
Figure 3. Number of included studies by year of publication.
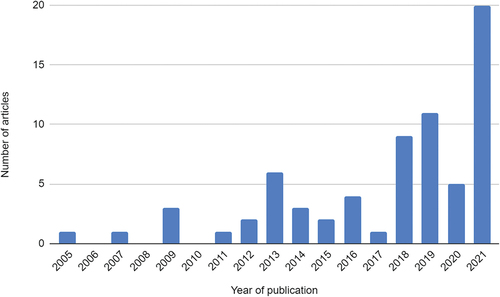
Table 1. Summary of main findings in the included studies.
Table 2. SISRI-24 worldwide validation data from selected studies.
Table 3. SI correlated attributes by major domains.