
Figures & data
Figure 1. Flow chart for the selection of study participants.
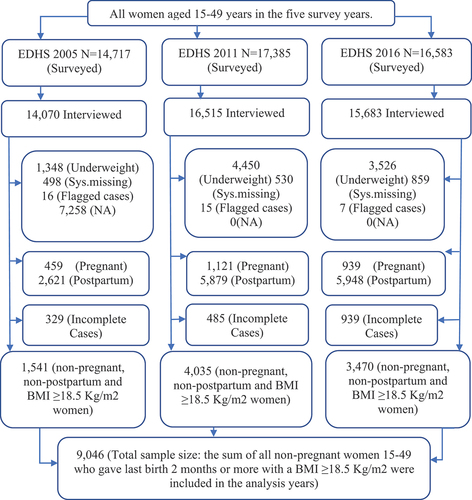
Table 1. Background characteristics (weighted %) of non-pregnant and non-postpartum women of the Ethiopian demographic and health survey years 2005, 2011, and 2016 (N = 9046).
Figure 2. Location of Ethiopia (a) and Prevalence of overweight and obesity by region 2005(b), 2011(c), 2016(d) (. A source: Britannica). OvOb: Overweight and Obesity.
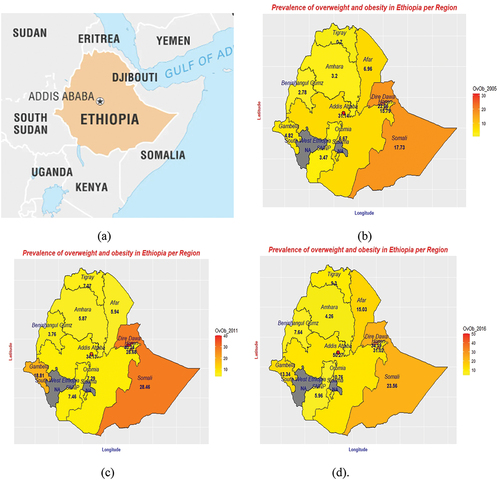
Table 2. Trends in the prevalence of overweight and obesity among non-pregnant women aged 15–49 per region (weighted) in the years 2005, 2011, and 2016 (N = 9,046).
Table 3. Multilevel mixed effect logistic regression analysis of individual- and regional-level factors associated with prevalence of overweight and obesity among reproductive age women in Ethiopia, 2005, 2011, and 2016.