Figures & data
Figure 1. Methodology timeline.
Figure 2. Effects of age, stress, and honey treatment on (A) body weight and (B) percentage of body weight changes. The values are expressed as mean ± S.E.M. Significant main effects of age (§§P < .01). Significant main effects of stress (#P < .05). Significant difference between no stress and stress control (¤P < .05).
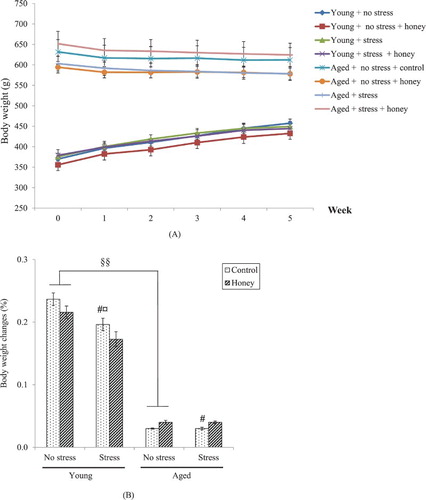
Table 1. Effects of age, stress, and honey treatment on serum corticosterone and ACTH levels.
Figure 3. Effects of stress and honey treatment on mean discrimination index ratio of (A) short-term memory and (B) long-term memory. The values are expressed as mean ± S.E.M. Significant main effects of stress (#P < .05). Significant main effects of honey treatment (**P < .01). Significant difference between no stress and stress control (¤P < .05, ¤¤P < .01). Significant difference between stress control and stress treated with honey (♣♣P < .01).

Figure 4. Effects of age, stress, and honey treatment on (A) MDA and (B) PCO levels. The values are expressed as mean ± S.E.M. Significant main effects of age (§§P < .01). Significant main effects of stress (#P < .05). Significant main effects of honey treatment (*P < .05). Significant difference between no stress and stress control (¤P < .05). Significant difference between stress control and stress treated with honey (♣P < .05, ♣♣P < .01).

Table 2. Effects of age, stress, and honey treatment on brain antioxidant enzymes.
Table 3. Effects of age, stress, and honey treatment on neuronal densities in mPFC and hippocampal regions.
Figure 5. Histology of mPFC. Groups: Young (A) no stress, (B) no stress + honey, (C) stress, (D) stress + honey, and Aged (E) no stress, (F) no stress + honey, (G) stress, (H) stress + honey. The arrows indicate the cells of interest (Nissl staining × 200, scale bar: 100 μm).
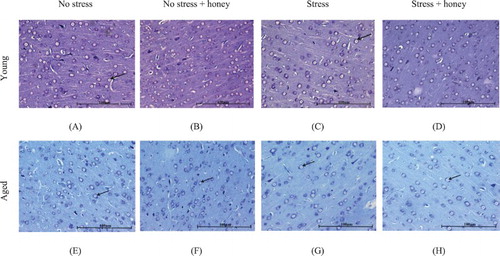
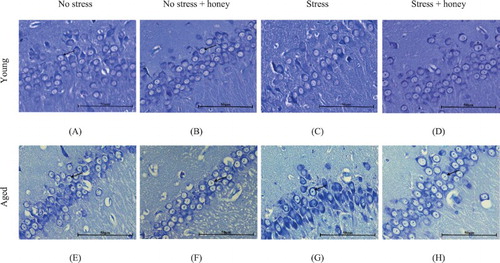
Figure 6. Histology of CA2 hippocampal area. Groups: Young (A) no stress, (B) no stress + honey, (C) stress, (D) stress + honey, and Aged (E) no stress, (F) no stress + honey, (G) stress, (H) stress + honey. The arrows indicate the cells of interest (Nissl staining × 400, scale bar: 50 μm).