Figures & data
Figure 1. XRD pattern of Batn El-Ghoul kaolin (a) before leaching and (b) after leaching.
Table 1. The chemical results of kaolin samples before and after leaching.
Figure 2. Fe2O3 content before and after chemical leaching. K1–K5: kaolin samples.
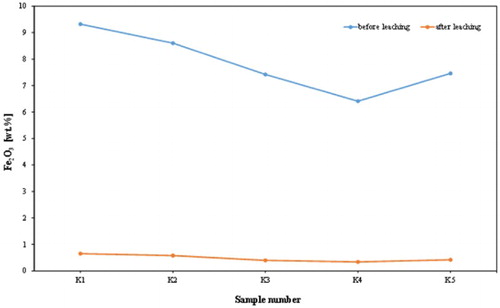
Figure 3. Al2O3 content before and after chemical leaching. K1–K5: kaolin samples.
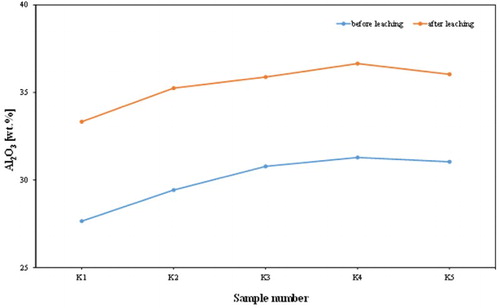
Figure 4. Kaolin content before and after chemical leaching. K1–K5: kaolin samples.
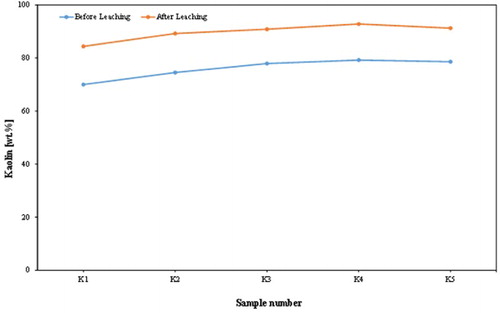
Figure 5. TiO2 content before and after chemical leaching. K1–K5: kaolin samples.
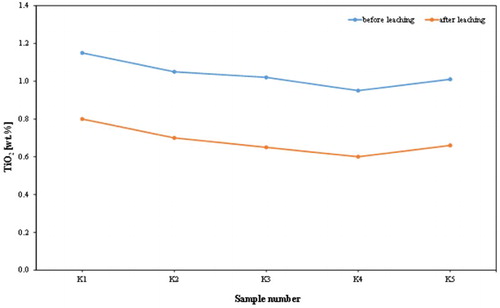
Figure 6. K2O content before and after chemical leaching. K1–K5: kaolin samples.
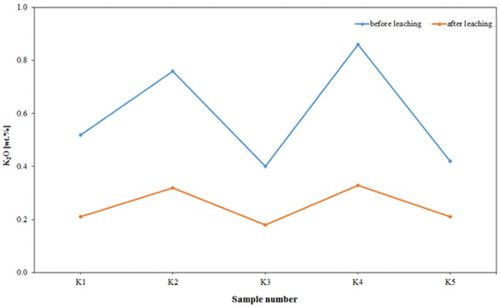
Table 2. Comparative analysis of leached Jordanian kaolin with a refined commercial kaolin and with theoretical kaolinite.
Figure 7. Brightness measurements of the analysed samples before and after chemical leaching compared with standard of brightness (MgCO3).
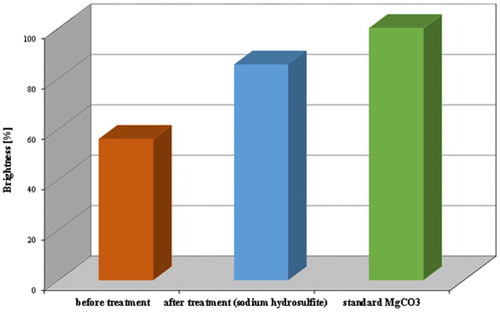
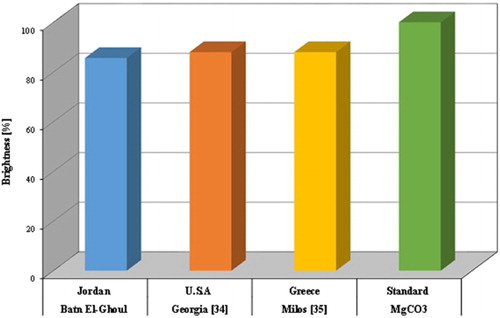
Figure 8. Typical leached brightness percentage of refined Batn El-Ghoul kaolin compared with a standard of brightness (MgCO3) and well-known leached kaolins.