Figures & data
Table 1. A comparison of the RMS error using the global and the local MRBF with a cubic polynomial.
Figure 1. The 4688 scanned points for the Anthurium leaf (left figure) and the 3388 scanned points for the Frangipani leaf (right figure) in 2D.
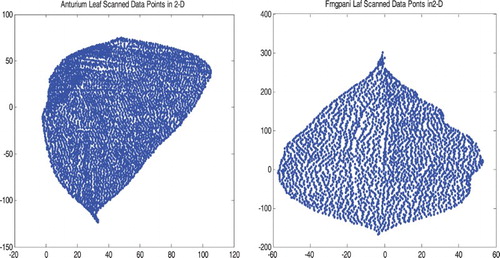
Figure 2. The Anthurium leaf data before projection into a new reference plane (left figure) and after projection (right figure).
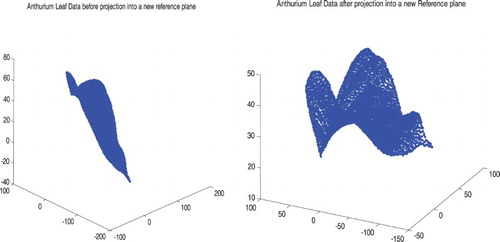
Figure 3. The 212 points that used to construct a global MRBF for the Anthurium leaf (left figure). The figure on the right represents the 141 points that used to construct a global MRBF for the Frangipani leaf.
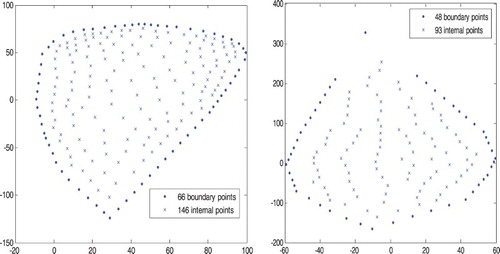
Table 2. The relative RMS and relative maximum error for the Anthurium and Frangipani leaf data points computed using the global MRBF with a cubic polynomial.
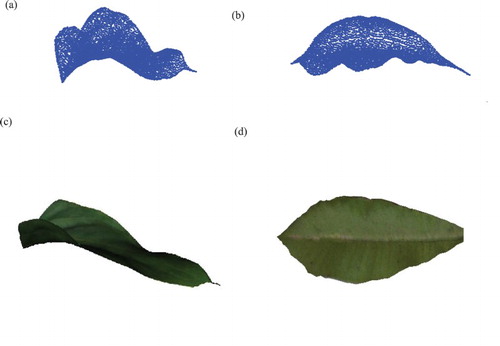
Figure 4. (a) and (b) represent the Anthurium and Frangipani leaf surface model, respectively, constructed from the points (shown in ) using the proposed CMRBF method. (c) and (d) the corresponding visualization of the Anthurium and Frangipani leaf model.