Figures & data
Figure 1. Schematic diagram of synthesized Mn3O4 nanoparticles.
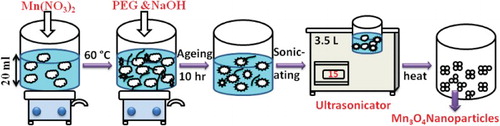
Figure 2. Powder X-ray diffraction (XRD) pattern of the synthesized Mn3O4 nanoparticles.
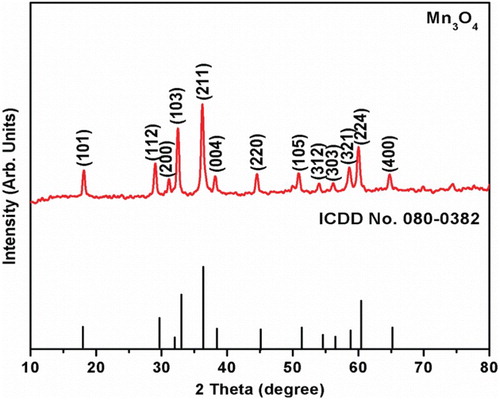
Table 1. XRD parameters of synthesized Mn3O4 nanomaterials.
Figure 3. XPS (a) Survey spectrum, (b) deconvolution spectra of Mn 2p, (c) deconvolution spectra of Mn 3s and (d) deconvolution spectra of O 1s for Mn3O4 nanoparticles.
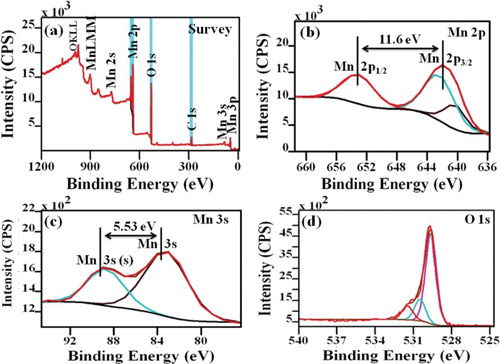
Figure 4. FE-SEM morphology and EDX spectra of Mn3O4 nanoparticles.
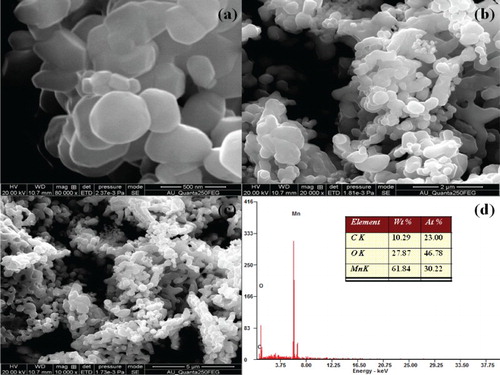
Figure 5. Cyclic voltammetry curves of prepared Mn3O4 electrode material recorded at scan rate of 5–100 mV s−1.
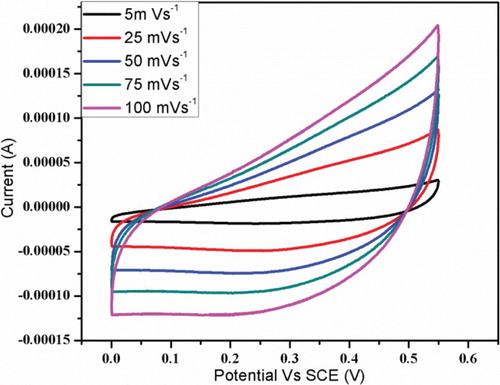
Figure 6. Charge-discharge curves of the prepared electrode materials at different current densities of 1–10 A g−2.
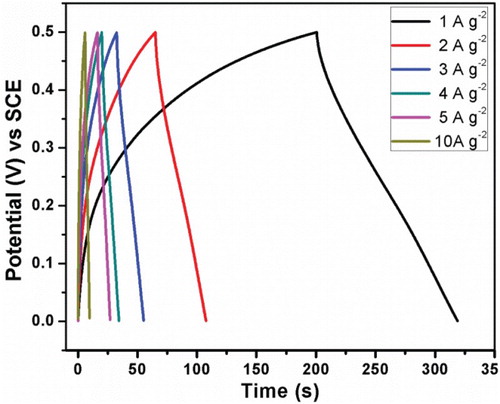
Figure 7. Specific capacitance vs. scan rate for prepared Mn3O4 electrode materials at different scan rate. Insert figure showing the decrease in specific capacitance with increase in applied current.
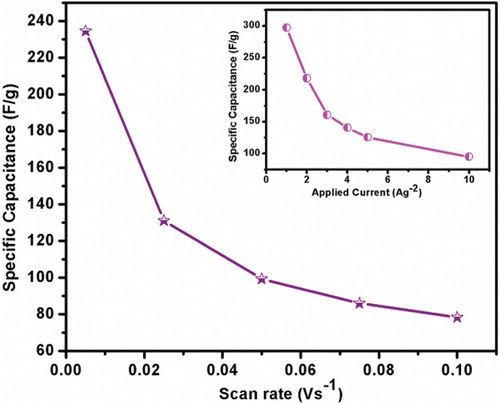
Figure 8. (a) Cycle stability for the electrode Mn3O4 material recorded at the current density of 3 A g−1 up to 1000 cycles and (b) Continuous charge-discharge cycles.
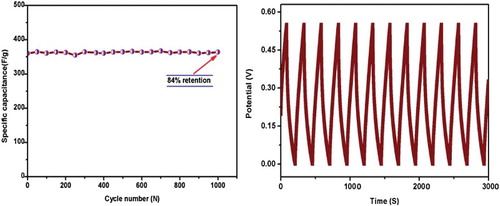
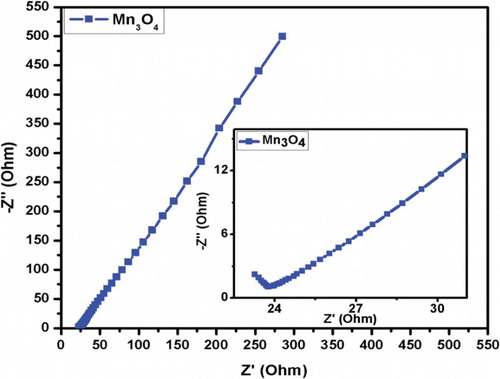
Figure 9. Nyquist plot for prepared Mn3O4 electrode materials. Insert figure shows the impedance at higher frequency region.