Figures & data
Table 1. The numerical results of Example 5.1.
Table 2. Numerical results of Example 5.1, for different fractional order  .
.
Figure 1. The solution graph of Example 5.1, for at different fractional order.
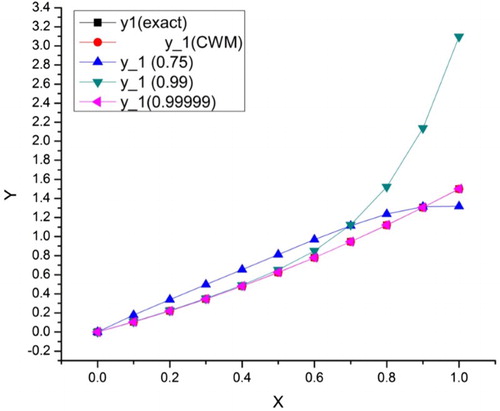
Figure 2. The solution graph of Example 5.1, for at different fractional order.
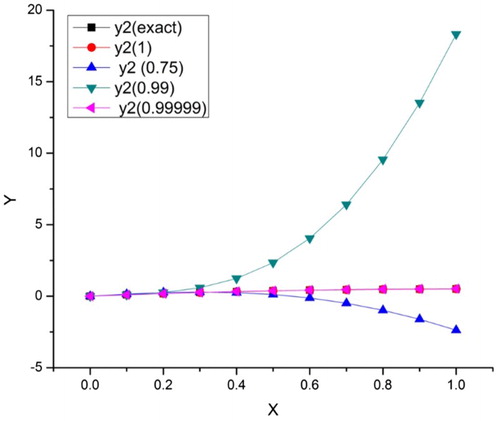
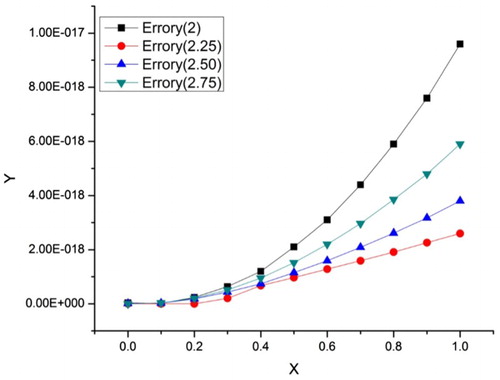
Table 3. Errors of Example 5.1, for different fractional order .
Table 4. The numerical solutions of Example 5.2.
Table 5. The errors of Example 5.2 for .
Table 6. Numerical results of Example 5.2 for different orders .
Figure 3. Solution graph of Example 5.2 for at different fractional order.
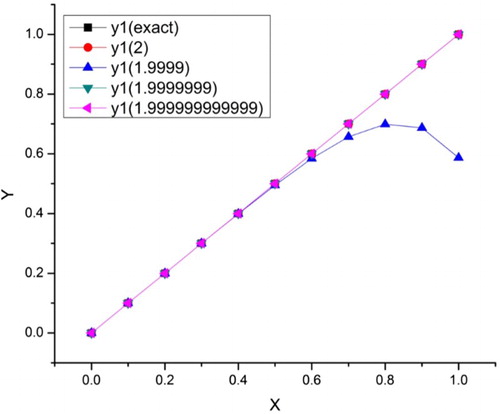
Figure 4. Solution graph of Example 5.2 for at different fractional order.
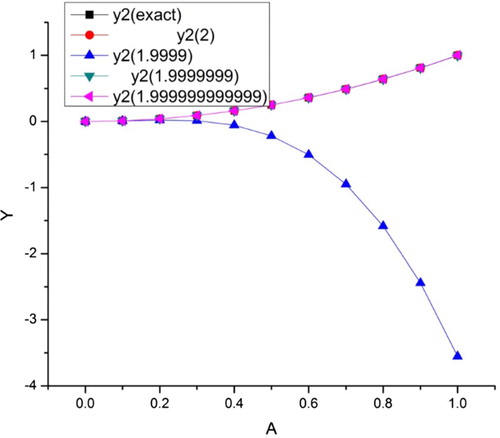
Figure 5. Solution graph of Example 5.2 for at different fractional order.
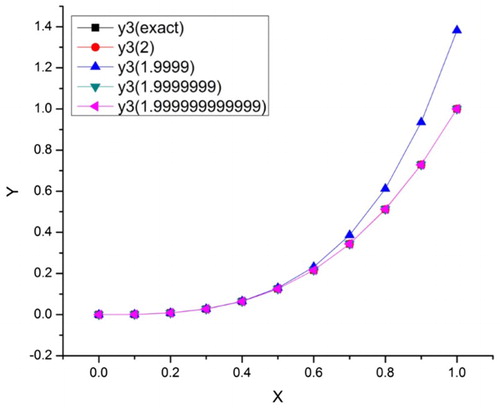
Table 7. The error analysis of Example 5.2 for different order.
Table 8. Numerical results for Example 5.3.
Figure 6. The graph of and
of Example 5.3.
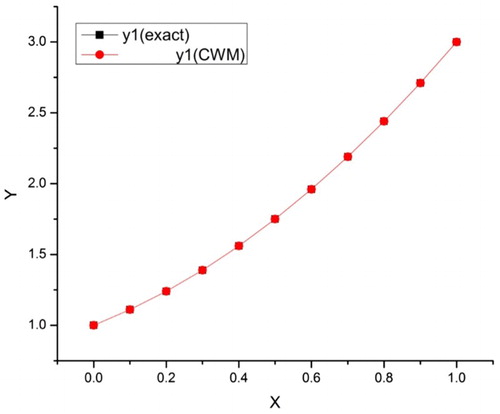
Figure 7. The solution graph of and
.
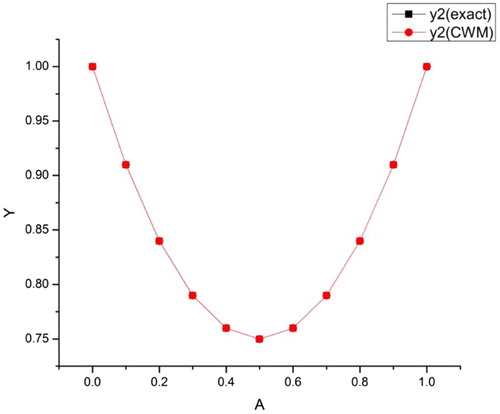
Figure 8. The error graph of and for other fractional orders.
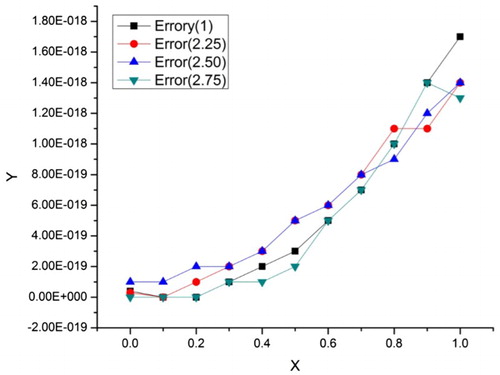
Figure 9. The error graph of for different fractional order
, where
.