Figures & data
Figure 1. Water sampling locations (A–H) in Osun River, Osogbo. The triangle, square and star represent Ebunoluwa International School, National Open University and Fountain University, respectively
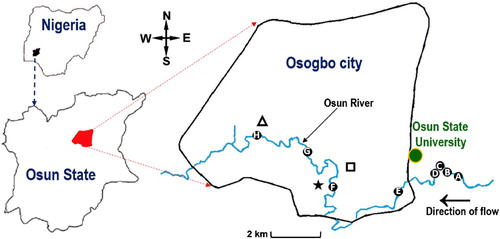
Table 1. The geographical coordinates of the sampling locations and average physico-chemical properties of Osun River.
Figure 2: Distribution trend of the concentrations of major heavy metals at different locations in Osun River. Each value is an average concentration of the three measurements obtained in July (2017), February (2018) and July (2018) study events.
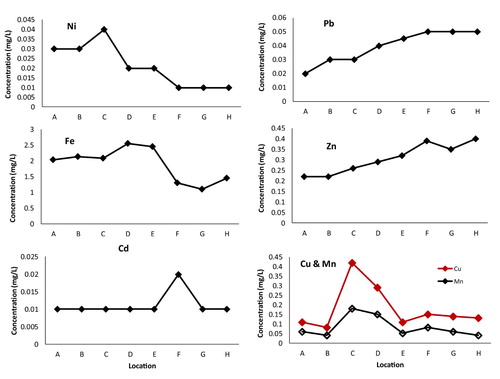
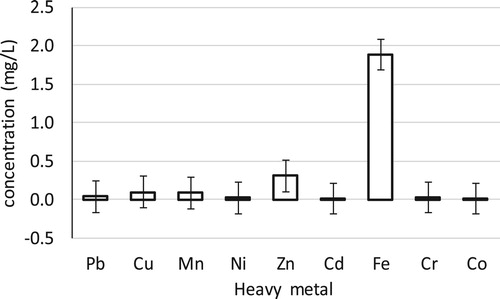
Figure 3. Concentrations of the measured heavy metals in Osun River. Results are expressed as mean ± SE. Metal concentration is the average value of the concentrations obtained for each metal at the eight sampling locations during July (2017), February (2018) and July (2018) study events.