Figures & data
Table 1. List of investigated taxa and their codes.
Table 2. List of RAPD, ISSR and SCoT primers and the sequences used in this study, number of total bands, polymorphic bands and percentage of polymorphism of each primer generated.
Table 3. The morphological characters of the studied Plantago species.
Table 4. Karyotype parameters of somatic chromosomes of genus Plantago in KS.
Figure 1. Chromosomes of six species of Plantago in KSA(X = 1000). A: P. albicans. B: P. ciliata. C: P. amplexicaulis. D: P. lanceolata. E: P. psammophilia. F: P. ovata.
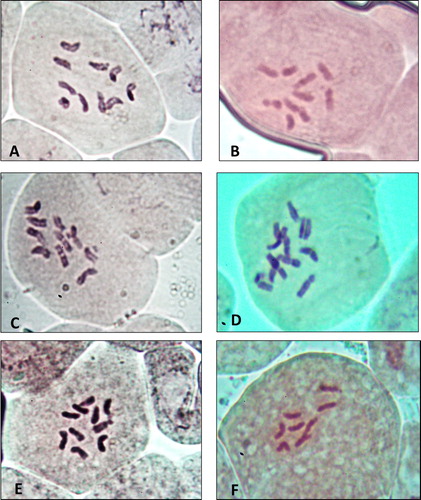
Figure 2. Karyogram of the selected species of Plantago (Bar = 25 µm). A: P. albicans. B: P. ciliata. C: P. amplexicaulis. D: P. lanceolata. E: P. psammophilia. F: P. ovata.
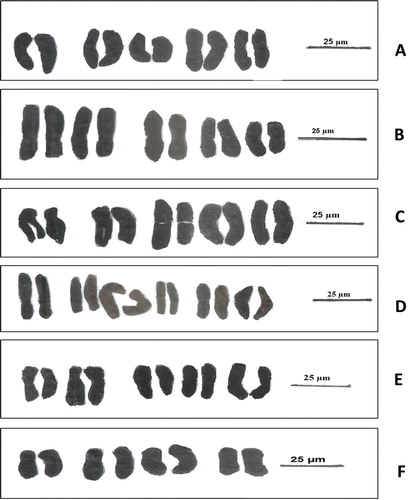
Figure 3. Ideogram representation of the haploid chromosome length of six species of Plantago. A: P. albicans. B: P. ciliata. C: P. amplexicaulis. D: P. lanceolata. E: P. psammophilia. F: P. ovata.
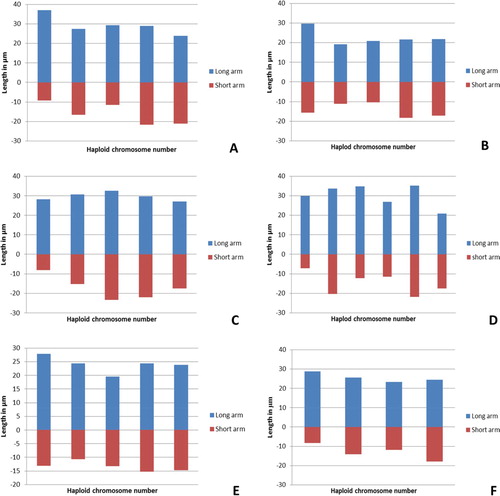
Table 5. Bands characteristics produced by molecular markers (RAPD, ISSR & SCoT) in different Plantago species.
Figure 4. The amplification profile of seven RAPD primers for six studied taxa of Plantago species in KSA. 1: P. albicans. 2: P. ciliata. 3: P. amplexicaulis. 4: P. lanceolata. 5: P. psammophilia. 6: P. ovata.
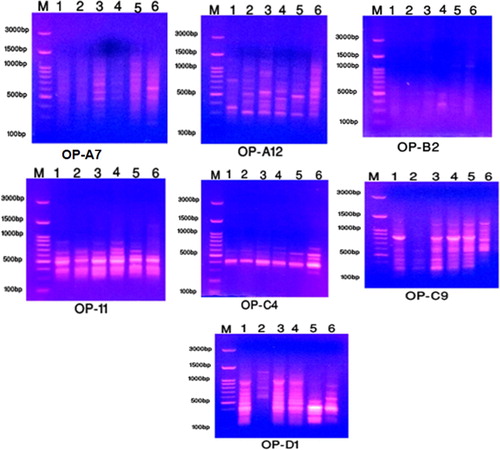
Figure 5. The amplification profile of five ISSR primers for six studied taxa of Plantago species in KSA. 1: P. albicans. 2: P. ciliata. 3: P. amplexicaulis. 4: P. lanceolata. 5: P. psammophilia. 6: P. ovata.
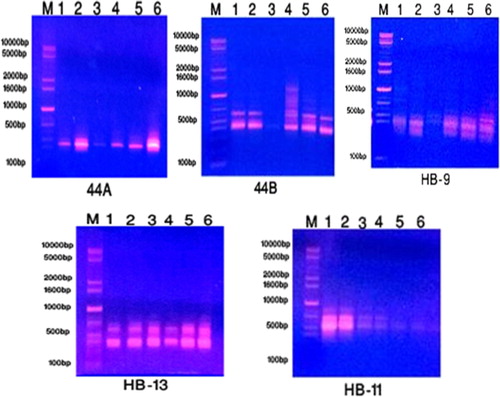
Figure 6. The amplification profile of five SCoT primers for six studied taxa of Plantago species in KSA. 1: P. albicans. 2: P. ciliata. 3: P. amplexicaulis. 4: P. lanceolata. 5: P. psammophilia. 6: P. ovata.
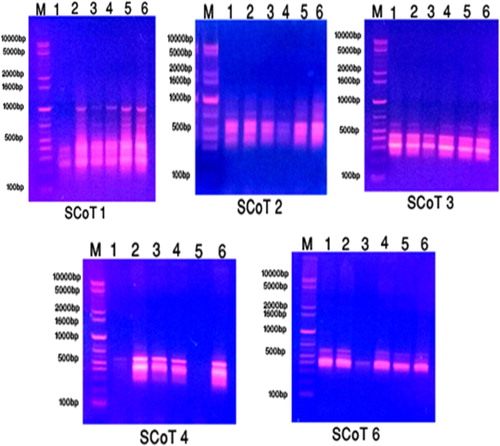
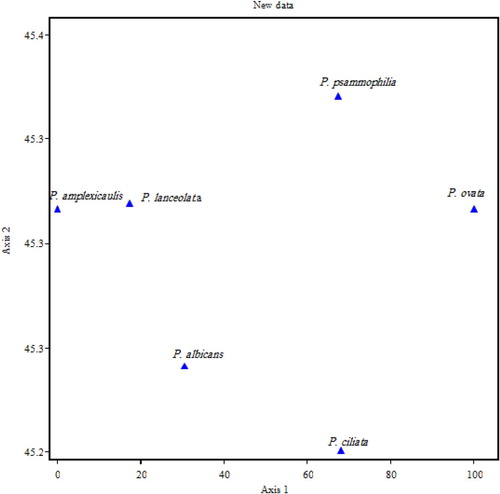
Figure 7. Percptual mapping (Biplot) of the studied species of Plantago L. based on cytological parameters and molecular attributes. P 1: P. albicans. P2: P. ciliata. P 3: P. amplexicaulis. P4: P. lanceolata. P5: P. psammophilia. P6: P. ovata.
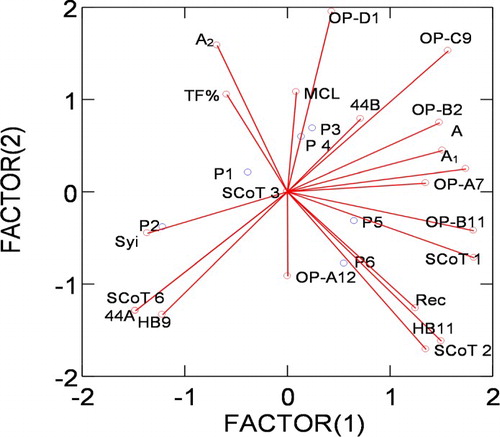
Figure 8. Cluster phenogram showing the relationships between the studied taxa of Plantago using Euclidean coefficient and single linkage method. P 1: P. albicans. P2: P. ciliata. P 3: P. amplexicaulis. P4: P. lanceolata. P5: P. psammophilia. P6: P. ovata.
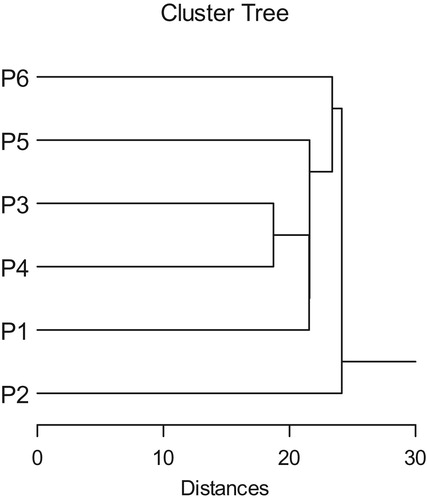
Table 6. Similarity indicies between the six studied species of Plantago L.
Figure 9. UPGAMA phenogram showing the relationships between the studied taxa of Plantago based on morphological, cytological parameters and molecular attributes.
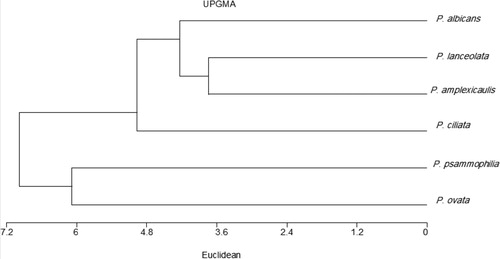
Figure 10. Scatter diagram of 6 species in the genus Plantago.