Figures & data
Figure 1. Chemical structure of nifedipine.
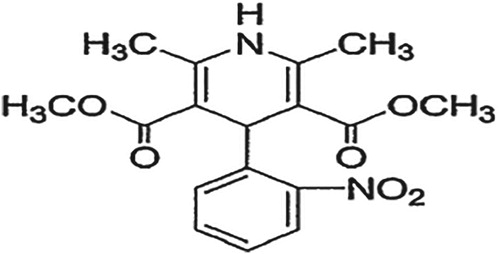
Figure 2. Chemical structure of valsartan.
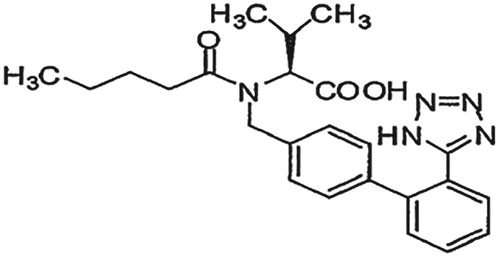
Figure 3. Overlay of absorbance spectra of NIF and VAL.
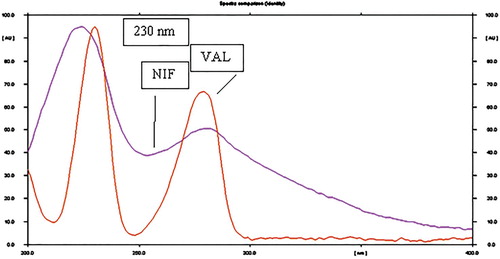
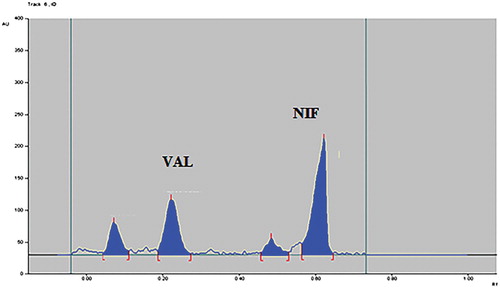
Figure 4. Densitogram of NIF and VAL.
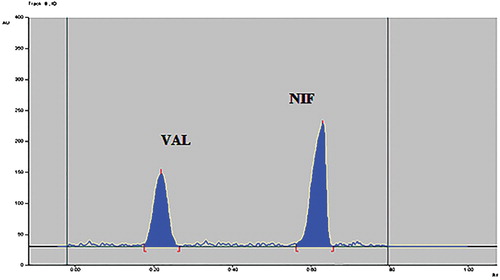
Table 1. Regression analysis of the calibration curve.
Table 2. Summary of validation parameter.
Figure 5. Densitogram of base (0.1 N NaOH) hydrolysed sample of VAL and NIF.

Figure 6. Densitogram of acid (1 N HCl) hydrolysed sample of VAL and NIF.
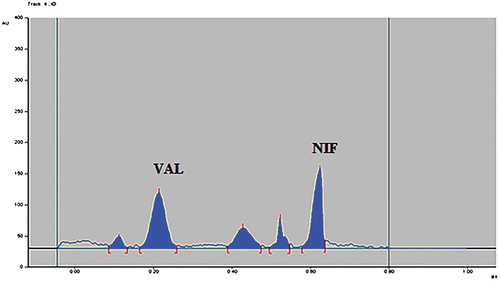
Figure 7. Densitogram of dry heat degraded sample of VAL and NIF.
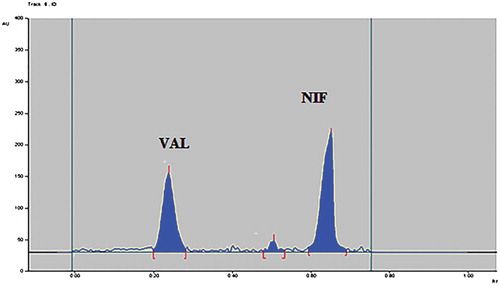
Figure 8. Densitogram of photolytic degraded sample of VAL and NIF.
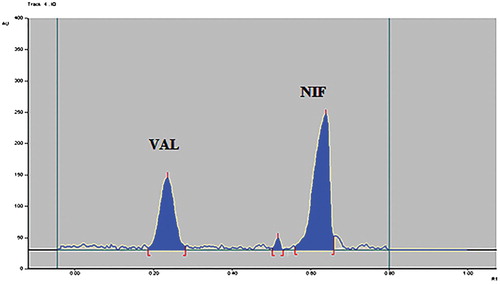
Figure 9. Densitogram of oxidative stress degraded sample of VAL and NIF.