Figures & data
Figure 1. Effects of EMR exposure and selenium administration into normal and diabetic rats on plasma triglycerides (mg/dl). Data are presented as mean ± SEM for six rats in each group. Significant difference at p<0.05 when compared to *control group, † EMR group, # diabetic group or ‡ T2DM+ EMR group.
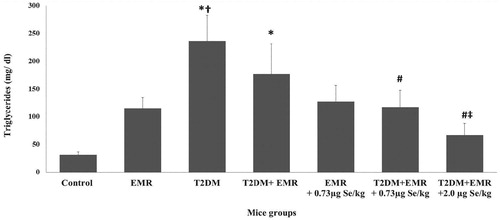
Table 1. Plasma Triglycerides and total cholesterol levels (mg/dl) in different groups of animals.
Figure 2. Effects of EMR exposure and selenium administration in different groups of normal and diabetic rats on plasma total cholesterol (mg/dl). Data are presented as mean ± SEM for six rats in each group. Significant difference at p<0.05 when compared to *control group, † EMR group or # diabetic group.
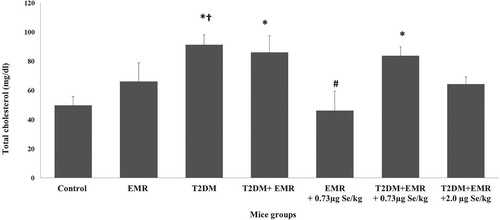
Figure 3. Effects of EMR exposure and selenium administration in different groups of normal and diabetic rats on plasma HDL-c (mg/dl). Data are presented as mean ± SEM for six rats in each group. Significant difference at p<0.05 when compared to * control group or # diabetic group.
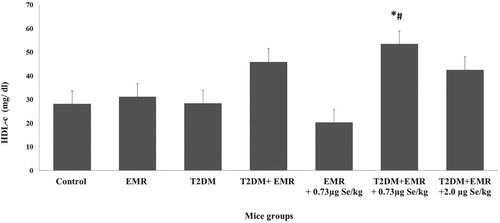
Figure 4. Effects of EMR exposure and selenium administration in different groups of normal and diabetic rats on plasma LDL-c (mg/dl). Data are presented as mean ± SEM for six rats in each group. Significant difference at p<0.05 when compared to *control group, † EMR group or # diabetic group.
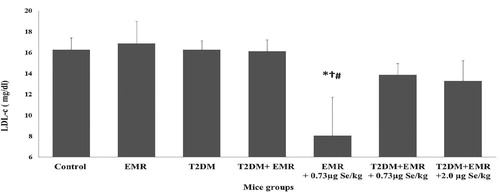
Figure 5. Effects of EMR exposure and selenium administration in different groups of normal and diabetic rats on LDL-c/HDL-c ratio. Data are presented as mean ± SEM for six rats in each group. Significant difference at p<0.05 when compared to † EMR group or # diabetic group.
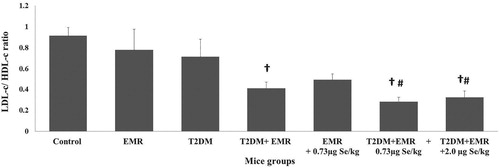
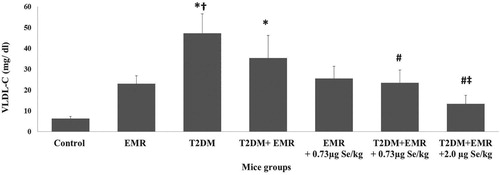
Figure 6. Effects of EMR exposure and selenium administration in different groups of normal and diabetic rats on plasma VLDL-c (mg/dl). Data are presented as mean ± SEM for six rats in each group. Significant difference at p<0.05 when compared to *control group, † EMR group, # diabetic group or ‡ T2DM+ EMR group.