Figures & data
Scheme 1. Synthesis of Schiff base ligand L.
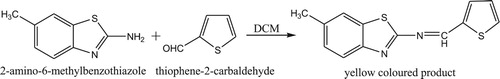
Figure 1. Mass spectrum of ligand L.
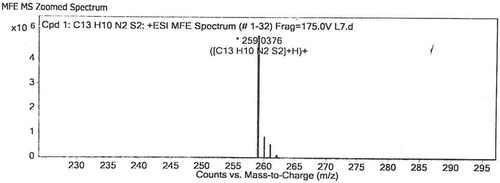
Figure 2. Mass spectrum of copper(II) complex of ligand, [CuL2(OAc)2].
![Figure 2. Mass spectrum of copper(II) complex of ligand, [CuL2(OAc)2].](/cms/asset/b49335f3-4e76-4086-9ad7-391eb13b1103/tusc_a_1681724_f0002_oc.jpg)
Figure 3. 1H NMR spectrum of ligand L.
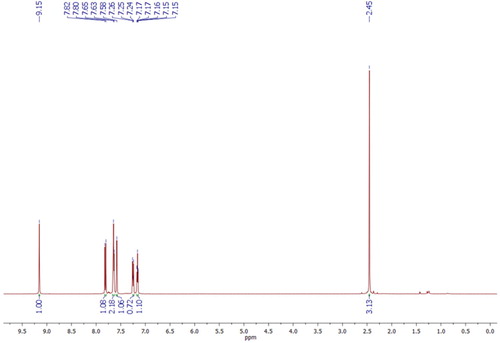
Figure 4. 13C NMR spectrum of ligand L.
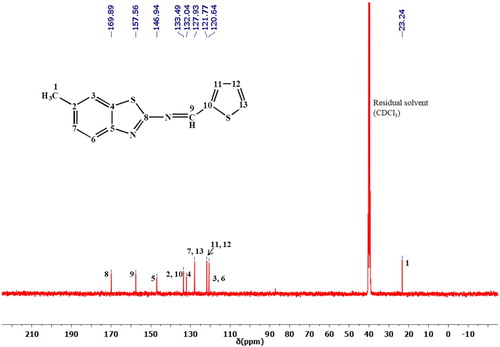
Figure 5. IR spectrum of ligand L. Inset, zoom IR spectrum of ML2.
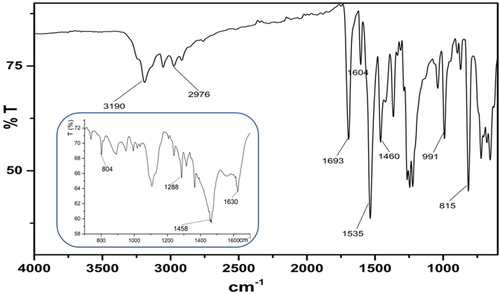
Figure 6. Electronic spectra of Cu(II) complex of Schiff base ligand L showing wide absorption upto 1100 nm.
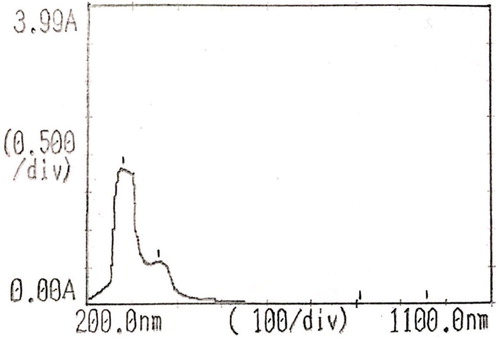
Figure 7. EPR spectrum of Cu(II) complex of Schiff Base ligand.
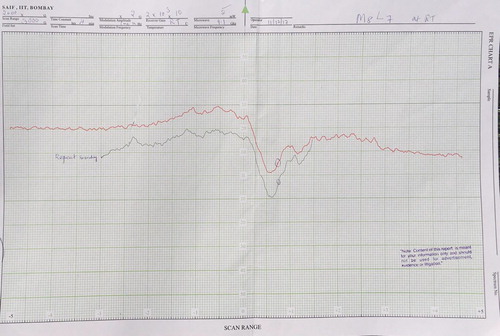
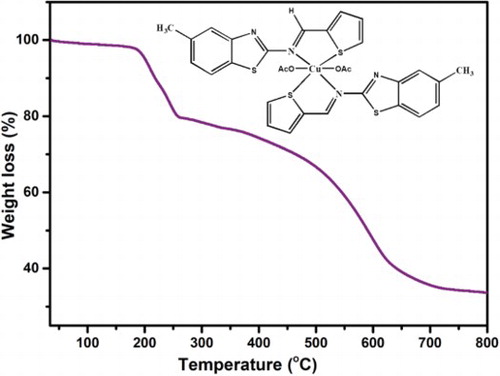
Figure 8. The proposed structure of Cu(II) complex [CuL2(OAc)2].
![Figure 8. The proposed structure of Cu(II) complex [CuL2(OAc)2].](/cms/asset/95fe6c05-6a64-4558-b19c-867623b9f9f0/tusc_a_1681724_f0008_ob.jpg)
Figure 9. The absorbance spectra of Cu(II) complex (1 × 10⁻⁵ M) and increasing the concentration of CT-DNA from zero to 120 µM in presence of 20 mM Tris- HCl buffer containing 100 mM NaCl, pH 7.4.
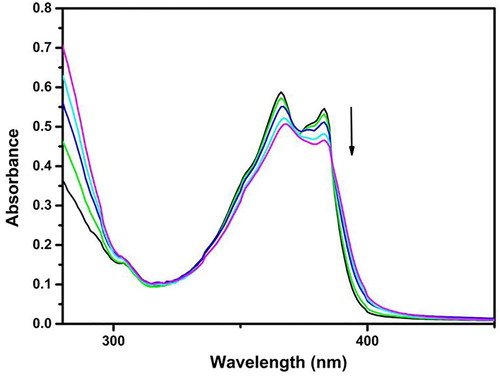
Figure 10. The fluorescence spectra of ligand L and Cu(II) complex ML2 (1 × 10⁻⁵ M) and increasing the concentration of CT-DNA from zero to 100 µM in presence of 20 mM Tris- HCl buffer containing 100 mM NaCl, pH 7.4, λex = 270 nm.
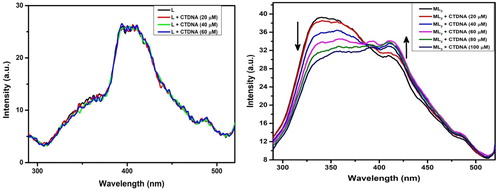
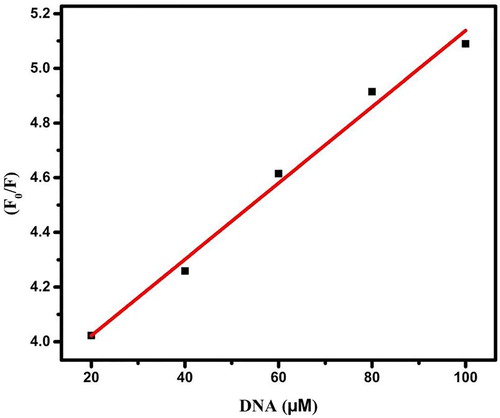
Figure 11. The plot of log (F0-F) /F versus log [CT-DNA].
![Figure 11. The plot of log (F0-F) /F versus log [CT-DNA].](/cms/asset/19b82e0a-8850-4c2d-8a3f-ffaa2b77a2ca/tusc_a_1681724_f0011_oc.jpg)
Figure 12. Stern-Volmer plot for quenching of ML2 by CT-DNA.