Figures & data
Figure 1. Physical configuration of AA7075 – water nanofluid system.
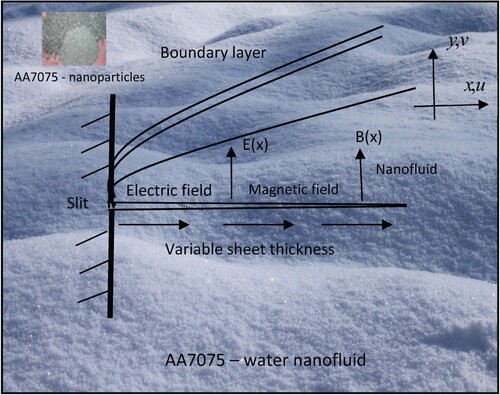
Table 1. Thermophysical resources of the fluid and nanoparticles.
Figure 2. Comparison of temperature profiles with Figure of Mair Khan et al. [Citation22].
![Figure 2. Comparison of temperature profiles with Figure 7 of Mair Khan et al. [Citation22].](/cms/asset/b93aa9b8-3ea5-44c8-90bb-eee18f0bde88/tusc_a_1823100_f0002_oc.jpg)
Figure 3. Magnetic effects on temperature profiles with different electric fields.
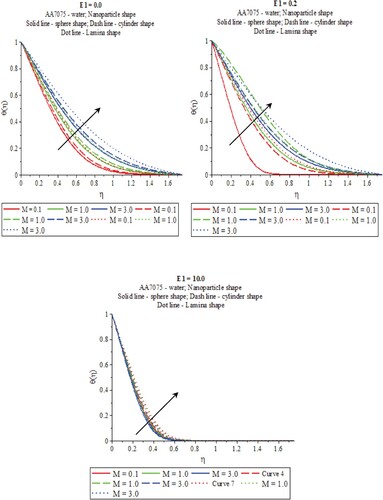
Figure 4. Thermal radiation effects on temperature profiles with different electric fields.
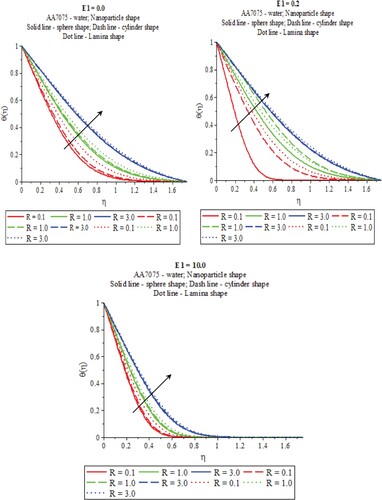
Table 2. Comparison of rate of heat transfer,  with different Pr.
Figure 5. Wall thickness strength on temperature profiles with different electric fields.
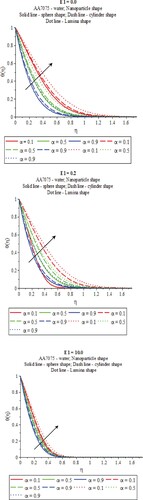
Figure 6. Thermophoresis impacts on temperature profiles with different electric fields.
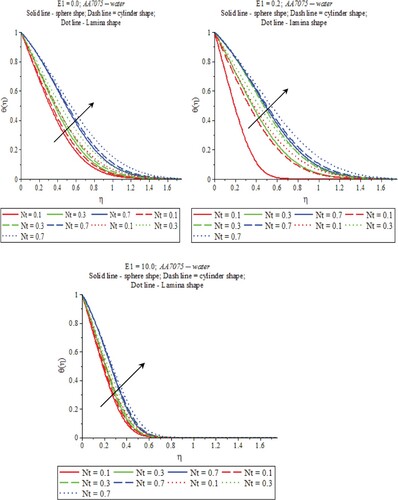
Figure 7. Brownian motion impacts on temperature profiles with different electric fields.
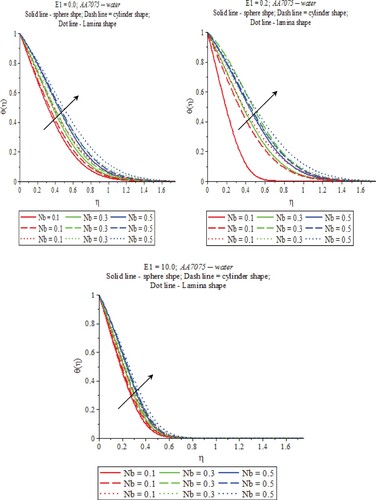
Figure 8. Chemical reaction on temperature profiles with different electric fields.
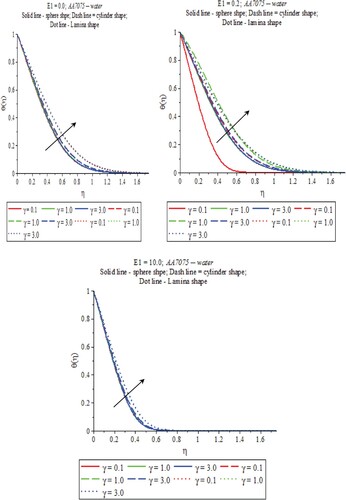
Figure 9. Heat generation on temperature profiles with different electric fields.
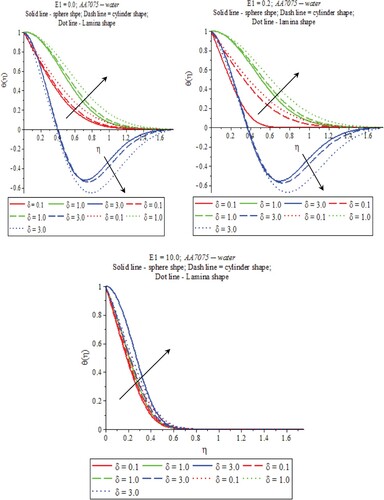
Figure 10. Nanoparticle volume part on temperature and focus profiles with various electric fields.
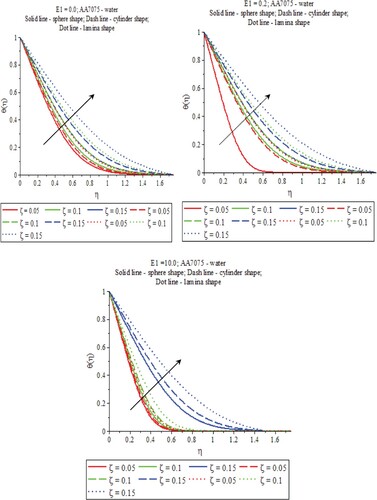
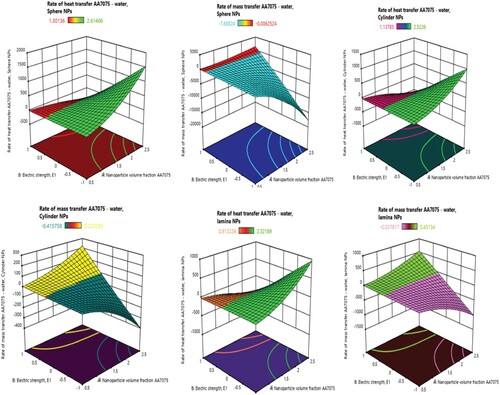
Figure 11. Streamline diagrams on warmth and mass exchange on electric field quality.