Figures & data
Table 1. The demographic data and glycated hemoglobin of healthy controls, diabetic non-treated and diabetics treated groups.
Figure 1. The levels of (A) TNF-α concentration, (B) IL-18 mRNA expression, (C) IL-23 mRNA expression, (D) IL-35 mRNA expression, (E) H. Pylori IgG concentration, (F) H. Pylori (Ag)% of healthy controls, diabetic non-treated group and diabetic treated groups. Values were considered significantly different at *P< 0.05, **P< 0.01 and ***P< 0.001 versus healthy controls; and +P< 0.05 and +++P < 0.001 versus diabetic non-treated group. IL; interleukin, TNF-α.; tumour necrosis factor-alpha, Met.: metformin, Glim.: glimepiride.
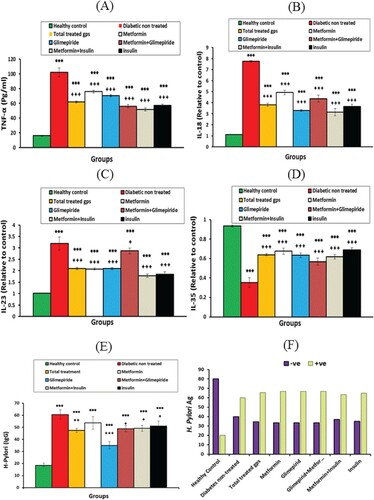
Figure 2. Correlations between H. Pylori IgG level with (A) BMI, (B) HbA1c, (C) TNFα, (D) IL-18, (E) IL-23, and (F) IL-35 values among metformin plus glimepiride treated group. Correlation was significant ** at the 0.01 level, *** at the 0.001 level. IL; interleukin, BMI: body mass index, TNF-α.; tumour necrosis factor-alpha, HbA1c: glycated hemoglobin.
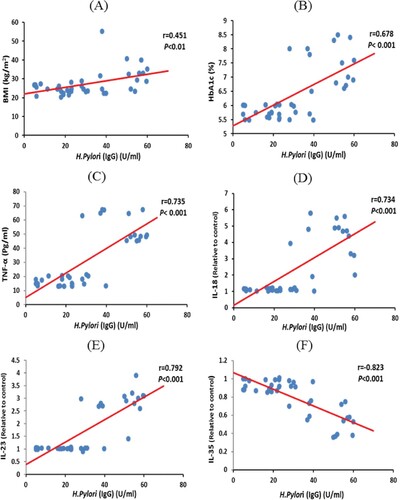
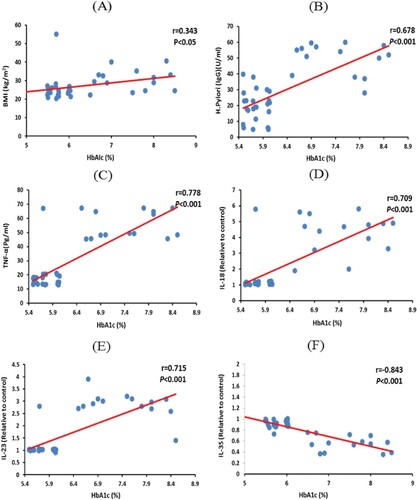
Figure 3. Correlations between HbA1c% with (A) BMI, (B) H. Pylori-IgG, (C) TNF-α, (D) IL-18, (E) IL-23, (F) IL-35 values among metformin plus glimepiride treated group. Correlation was significant * at the 0.05 level, *** at the 0.001 level. TNF-α.; tumour necrosis factor-alpha, HbA1c: glycated hemoglobin, IL; interleukin, BMI: body mass index.