
Figures & data
Figure 1. Dark-wave solutions of Equation (6) when in three, two-dimensional, and contour plot in two-dimensional plots.
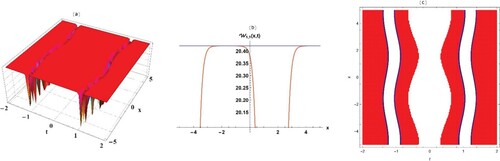
Figure 2. Bright wave solutions of Equation (7) when in three, two-dimensional, and contour plot in two-dimensional plots.

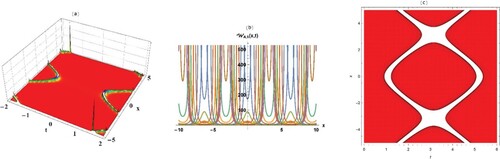
Figure 3. Dark-wave solutions of Equation (12) when in three, two-dimensional, and contour plot in two-dimensional plots.
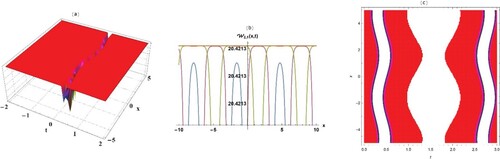
Figure 4. Periodic cone wave solutions of Equation (19) when in three, two-dimensional, and contour plot in two-dimensional plots.
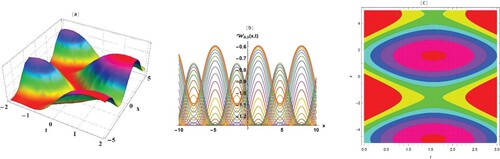
Figure 5. Periodic cone wave solutions of Equation (21) when in three, two-dimensional, and contour plot in two-dimensional plots.
Data Availability
All data used for the findings in this research are available publicly in manuscript.