Figures & data
Figure 1. Effect of various substrates on the pectinase production, protein concentration and mycelia growth in liquid static surface ferementation (LSSF) by Aspergillus parvisclerotigenus KX928754. Where RT: raw tea; UT: used tea; CP: citrus peel; OP: orange peel; BP: banana peel; AP: apple pomace; SB: sugarcane bagasse; CH: coffee husk; Control: Czapek-Dox medium containing 1% pectin but without sucrose. The data represents mean ± standard error of replicates (n = 3).
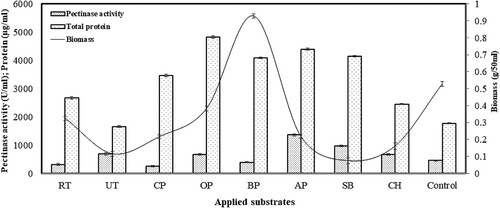
Figure 2. Effect of pH (a), incubation period (b) and incubation temperature (c) on the pectinase production and mycelia growth by Aspergillus parvisclerotigenus KX928754. pH optimization at 30°C and 144 h of incubation; incubation period optimization at 30°C and pH 7; temperature optimization at pH 7 and 168 h of incubation. The data represents mean ± standard error of replicates (n = 3).
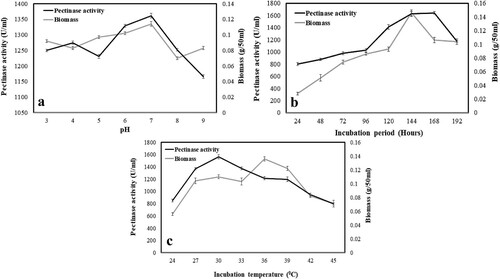
Figure 3. Effect of different carbon sources (a) and concentration of sucrose (b) on the pectinase production and mycelia growth by Aspergillus parvisclerotigenus KX928754. The data represents mean ± standard error of replicates (n = 3).
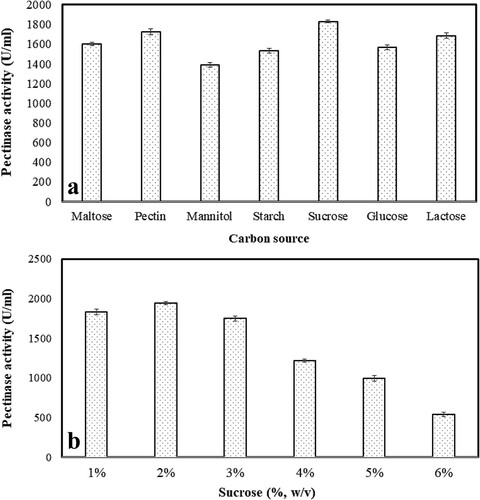
Figure 4. Effect of different nitrogen sources (a) and concentration of peptone (b) on the pectinase production by Aspergillus parvisclerotigenus KX928754. The data represents mean ± standard error of replicates (n = 3).
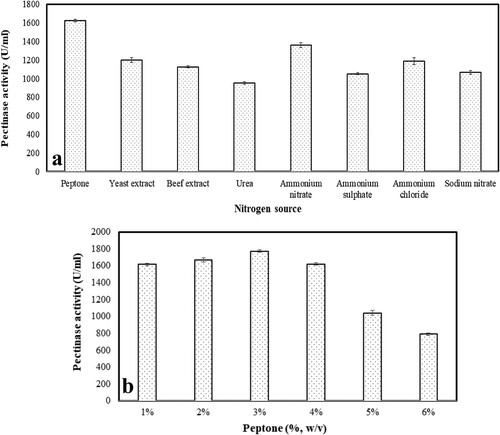
Table 1. Summary of purification and activity of pectinase obtained from Aspergillus parvisclerotigenus KX928754.
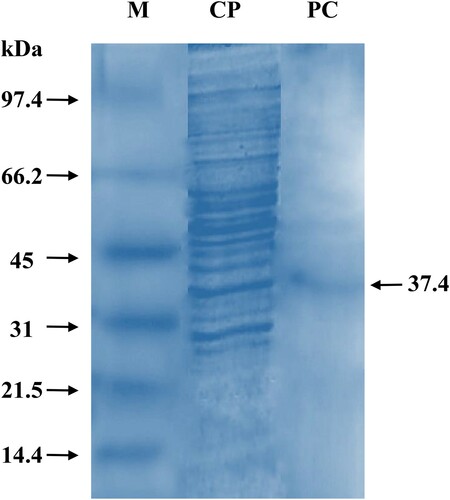
Figure 5. SDS-PAGE of pectinase enzyme isolated from Aspergillus parvisclerotigenus KX928754. M: molecular weight marker; CP: crude pectinase; PC: purified pectinase.