
Figures & data
Figure 1. GC–MS chromatogram of GCEO.
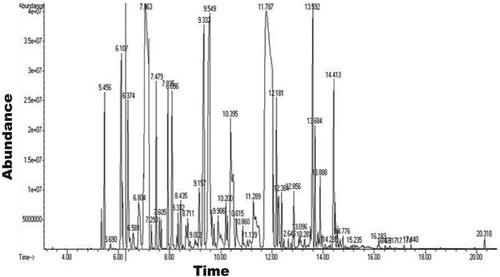
Table 1. Chemical composition of the GCEO.
Figure 2. Antioxidant activity of GCEO using (A) DPPH free radical scavenging assay, (B) Ferric chloride reducing assay. The values were expressed as mean ± SD calculation (n = 3).
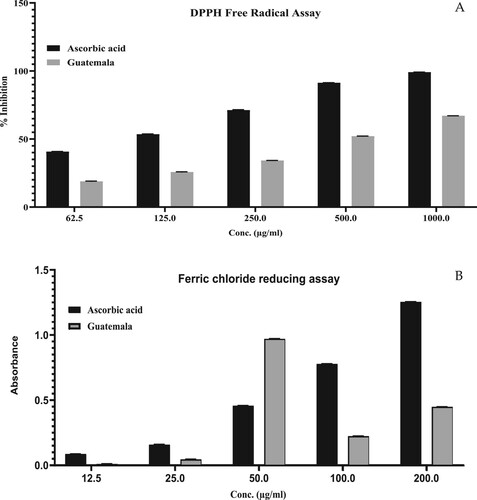
Figure 3. Anti-inflammatory activity of GCEO using (A) BSA inhibitory assay (B) Proteinase inhibitory assay. The values were expressed as mean ± SD calculation (n = 3).
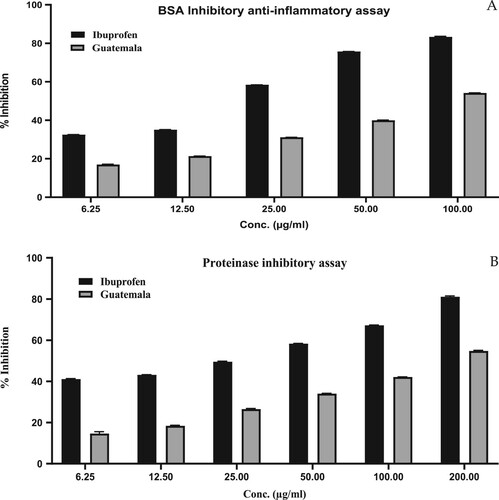
Figure 4. Interaction of 1HD2, 3CC6 and 3V99 protein with α-terpinyl acetate (1) and 1,8-cineole (2) inhibitors.
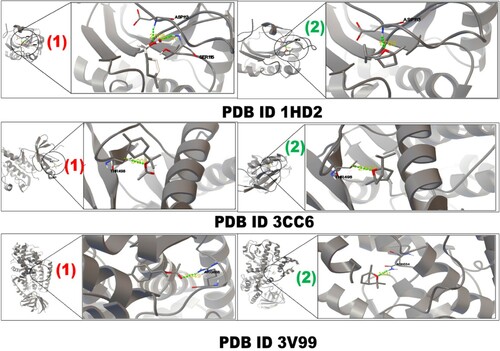
Table 2. The docking score, residues and hydrogen bond length for α-terpinyl acetate and 1,8-cineole with target proteins.
Figure 5. Chemical structure of the major volatile constituents, found in GCEO.
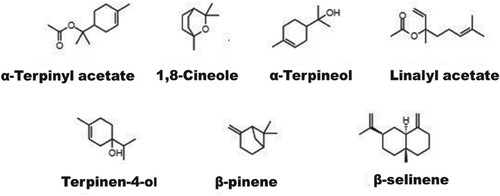
Figure 6. Bioavailability radar (A) and boiled-egg graph (B) of the selected compounds of GCEO.
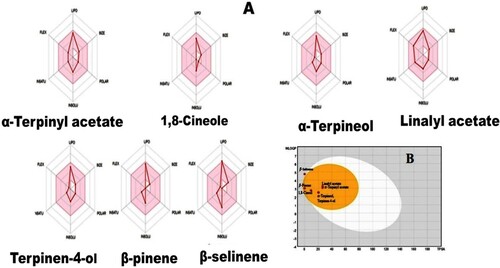
Table 3. PASS prediction bioactivities of major constituents of GCEO.
Table 4. In silico ADMET profile of GCEO compounds.