
Figures & data
Figure 1. Unified hybrid censoring scheme.
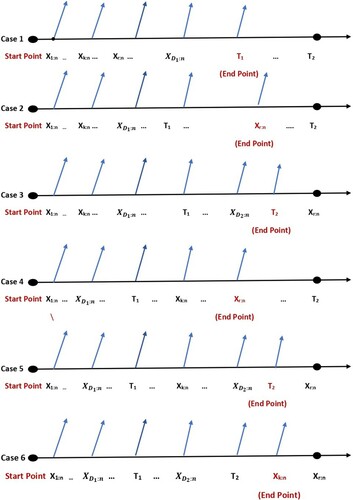
Table 1. MLE and Bayesian estimate of Shannon entropy based on UHCS under balanced loss functions () and
and MSE of all estimates.
Table 2. MLE and Bayesian estimate of Shannon entropy based on UHCS under balanced loss functions () and
and MSE of all estimates.
Figure 2. The MSE of Shannon entropy estimation for different values of sample size.
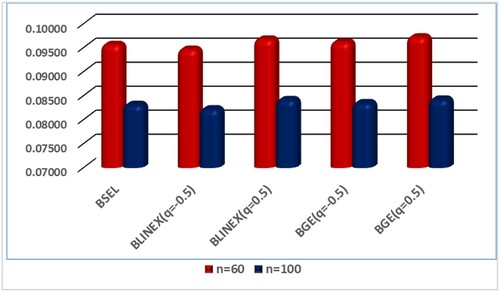
Figure 3. The MSE of Shannon entropy BEs based on BLINEX and BGE loss functions.
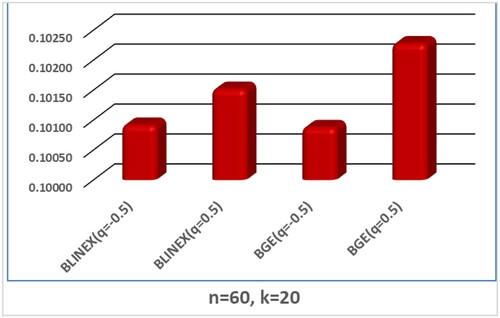
Figure 4. The MSE of Shannon entropy estimation under different values of k at n = 60.
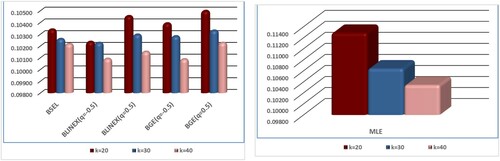
Figure 5. The MSE of Shannon entropy estimates at ( and
), (
and
) and (
and
) for
.
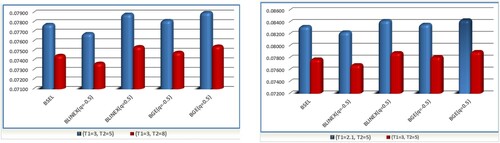
Figure 6. MCMC plots at .
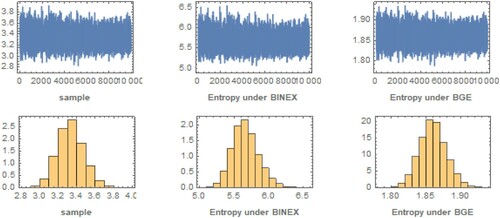
Figure 7. MCMC plots at .
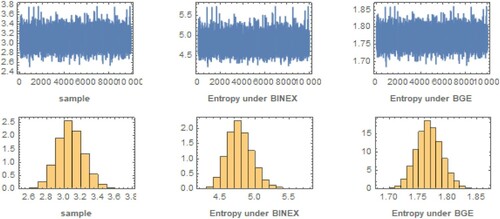
Figure 8. Estimated pdf and cdf of the Lo distribution for first data.
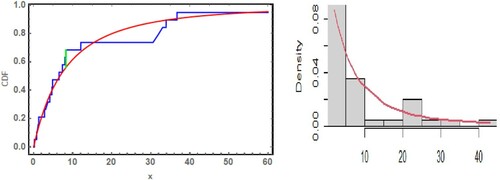
Table 3. Shannon entropy estimators for first data.
Figure 9. Estimated pdf and cdf of Lo distribution for second data.
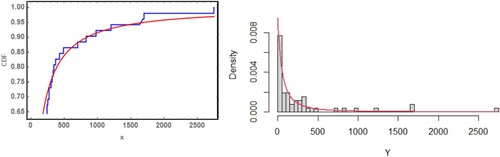
Figure 10. The trace plot and histogram of posterior samples for case 1 of UHCS for the first real data.
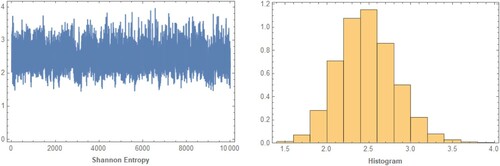
Figure 11. The trace plot and histogram of posterior samples for case 1 of UHCS for the second real data.
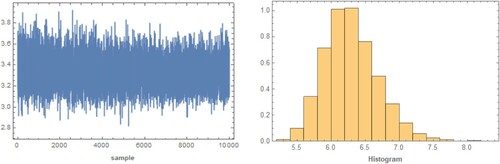
Table 4. Shannon entropy estimators for second data.