Figures & data
Figure 1. Over-expression of colon cancer repressed miRNA-128 reduced the proliferation of colon cancer cells. (A) RT-PCR expression analysis of miRNA-128 in colon cancer and corresponding normal human tissues; (B) RT-PCR expression analysis of miRNA-128 in colon cancer cell lines (HT-29, RKO, SW480 and SW948) and normal colon epithelial cell line, CCD-18Co; (C) RT-PCR expression analysis of miRNA-128 in colon cancer cell line, HT-29 transfected with miR-128 mimics or miR-NC; (D) MTT assay for the estimation of viability of HT-29 cancer cells transfected with miR-128 mimics or miR-NC. The experiments were performed in triplicate and expressed as mean ± SD (*P < 0.05).
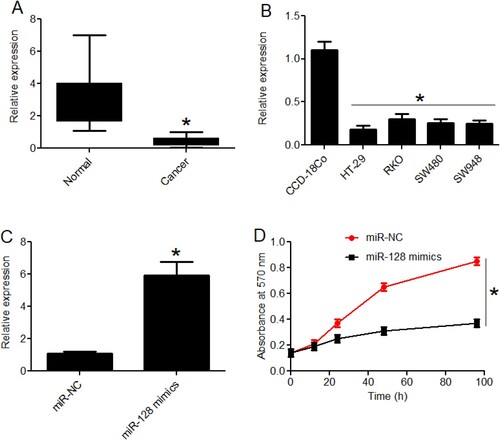
Figure 2. miR-128 over-expression declined colony formation and induced apoptosis in colon cancer cells. (A) Analysis of colony formation from HT-29 cancer cells transfected with miR-128 mimics or miR-NC; (B) AO/EB staining analysis of HT-29 cancer cells transfected with miR-128 mimics or miR-NC. Green, yellow and red colors indicate normal, early apoptotic and late apoptotic cells, respectively; (C) DAPI staining analysis of HT-29 cancer cells transfected with miR-128 mimics or miR-NC. Arrows indicate apoptotic cells; (D) flow cytometric examination of apoptosis of HT-29 cancer cells transfected with miR-128 mimics or miR-NC. The experiments were performed in triplicate and expressed as mean ± SD (*P < 0.05).
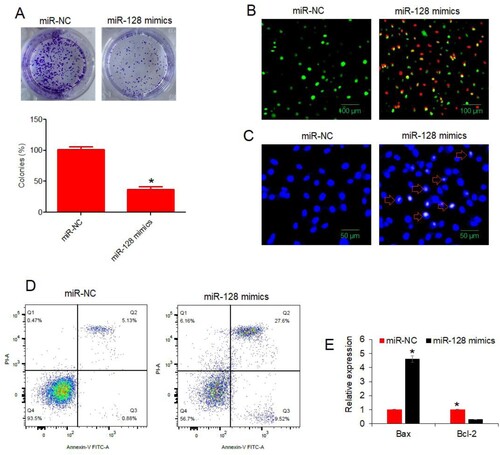
Figure 3. Rho family GTPase-3 (RND3) is targeted by miRNA-128 and modulates the growth regulatory role of miRNA-128 in colon cancer. (A) Bioinformatics target prediction of miRNA-128 in colon cancer; (B) dual luciferase reporter assay for the validation of miRNA-128 interaction with 3′-UTR of RND3 in colon cancer; (C) RT-PCR expression analysis of RND3 in colon cancer and corresponding normal human tissues; (D) RT-PCR expression analysis of RND3 in colon cancer cell lines (HT-29, RKO, SW480 and SW948) and normal colon epithelial cell line, CCD-18Co; (E) RT-PCR expression analysis of RND3 in colon cancer cell line, HT-29 transfected with si-RND3 or si-NC; (F) MTT assay for the estimation of viability of HT-29 cancer cells transfected with si-RND3 or si-NC; (G) MTT assay for the estimation of viability of HT-29 cancer cells transfected with miR-NC, miR-128 mimics or miR-128 mimics plus pcDNA-RND3. The experiments were performed in triplicate and expressed as mean ± SD (*P < 0.05).
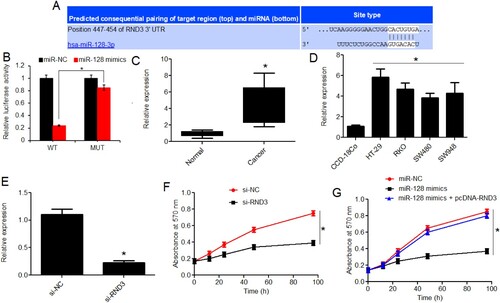
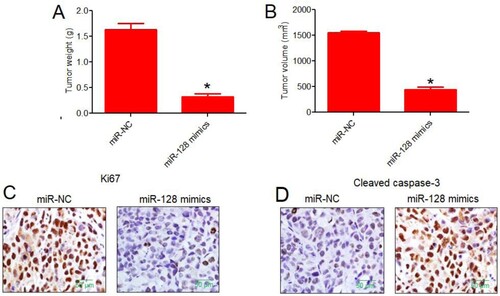
Figure 4. In vivo mice tumourigenesis study signified the tumour-suppressive role of miRNA-128 in colon cancer. (A) Average weight (g) of xenograft mice tumours collected from mice injected with HT-29 cancer cells over-expressing miRNA-128 or normal control HT-29 cancer cells; (B) average volume (mm3) of xenograft mice tumours collected from mice injected with HT-29 cancer cells over-expressing miRNA-128 or normal control HT-29 cancer cells; (C) immuno-histochemical fluorescence analysis of Ki67, proliferation marker from xenograft mice tumours collected from mice injected with HT-29 cancer cells over-expressing miRNA-128 or normal control HT-29 cancer cells; (D) immuno-histochemical fluorescence analysis of cleaved caspase-3, apoptosis marker from xenograft mice tumours collected from mice injected with HT-29 cancer cells over-expressing miRNA-128 or normal control HT-29 cancer cells. The experiments were performed in triplicate and expressed as mean ± SD (*P < 0.05).