
Figures & data
Figure 1. Sigmoid dependence of retention times of IBU and NPX on pH of the mobile phase at different molar strength of SDS (using 15% 1-propanol, keeping column temperature at 50°C), where A: 0.05 M SDS, B: 0.075 M SDS, C: 0.1 M SDS, D: 0.15 M SDS and E: 0.18 M SDS.
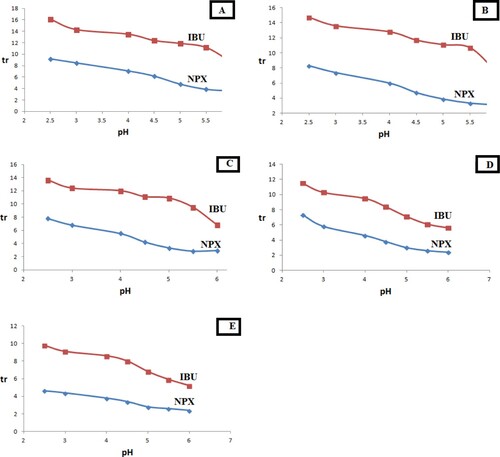
Figure 2. First-derivative curves for the dependence of the retention times of IBU and NPX on pH of the mobile phase at different molar strength of SDS (using 15% 1-propanol, keeping column temperature at 50°C), where A: 0.05 M SDS, B: 0.075 M SDS, C: 0.1 M SDS, D: 0.15 M SDS and E: 0.18 M SDS.
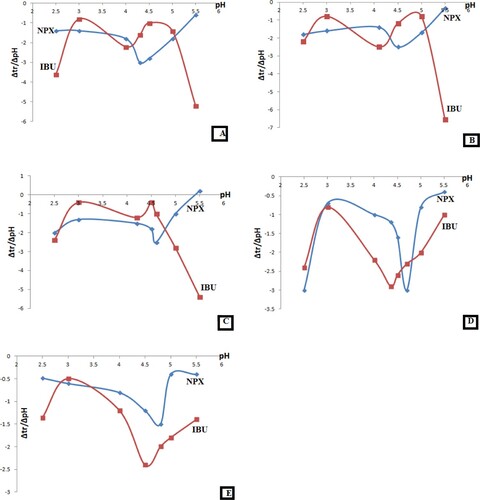
Table 1. Comparison of pKa values obtained by HMLC, reported and practical values using other methodologies.
Supplemental material