
Figures & data
Figure 1. Google earth location maps for the geophysical survey sites. (a) Al-Mokattam survey site in Egypt, where ERT and GPR carried out, while (b) the location for Riyadh investigated site, KSA, where GPR was the only available technique used in the site.
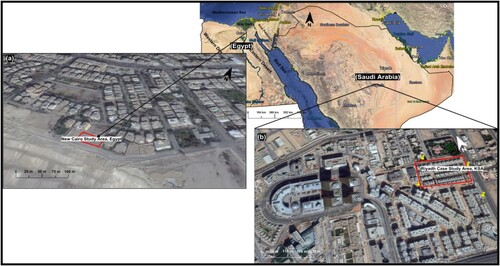
Figure 2. Diversity of fractures running in Al-Mokattam limestone Formation at Jabal Al-Mokattam Area.
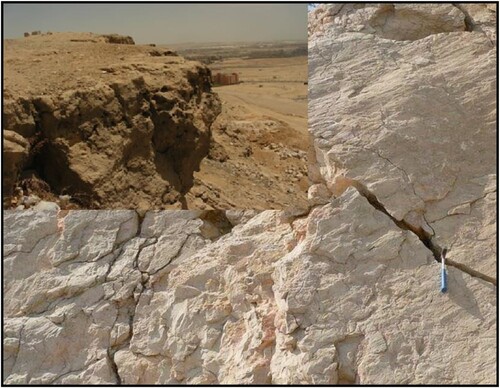
Figure 3. (a) Typical subsurface cavities developed in limestone at Riyadh construction site, KSA. (b) The size and dimension of cavities in limestone bedrock of Sulaiy formation.
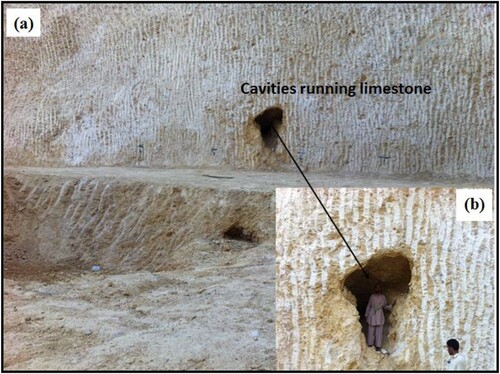
Figure 4. (a) Location map of the survey site. (b) The 400 MHz shielded antenna from GSSI used for acquisition of the relatively dense GPR data set at Al-Mokattam survey site in Egypt. String was used as guidelines for antenna movement, while measurement tape was used to place GPR antenna at each profile. (c) ERT measurement using Syscal-R2 multi-electrode system.
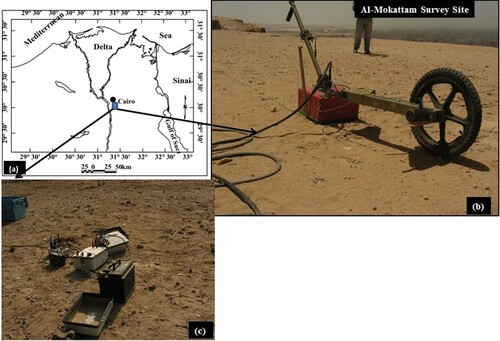
Figure 5. GPR data acquisition with 100 MHz shielded antenna using RAMAC system from MALA Geoscience. RTK was used to locate antenna positioning with high-accuracy differential GPS (TRIMBLE GPS 5800 with TSC).
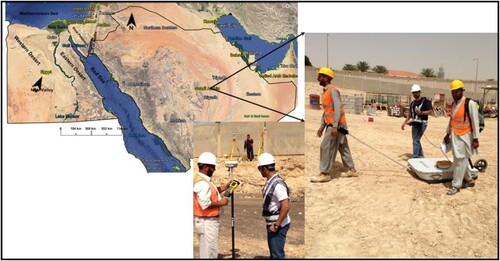
Table 1. Acquisition parameters for the RAMAC-100 MHz and the GSSI-400 MHz shielded antennas, GPR systems.
Figure 6. An example of GPR field data acquired with 400 MHz shielded antenna: (a) raw data, (b) data after dewowing, (c) data after signal processing, while (d) is the same profile with time cut after 80 ns to make fracture anomalies in subsurface more visible.
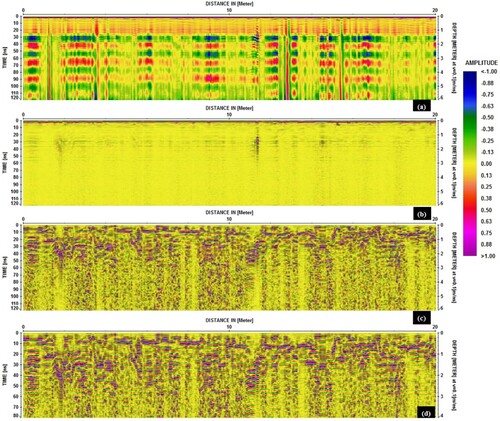
Figure 7. An example of GPR field data acquired with 100 MHz shielded antenna (RAMAC system): (a) raw data, (b) data after dewowing and AGC, (c) data after signal processing with background removal and bandpass filtering, (d) is the same profile with running average trace to smooth things up and make cavities features in subsurface more visible.
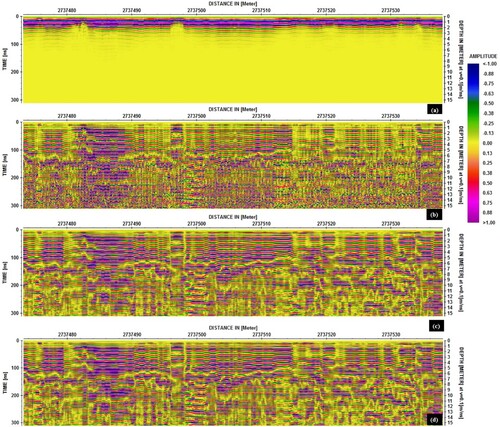
Figure 8. Common mid-point radar data acquired along Riyadh survey site using 100 MHz unshielded antenna: (a) CMP data collected and (b) velocity spectrum analysis obtained from (a) indicates that subsurface root mean square velocity is about 0.1 m/ns.
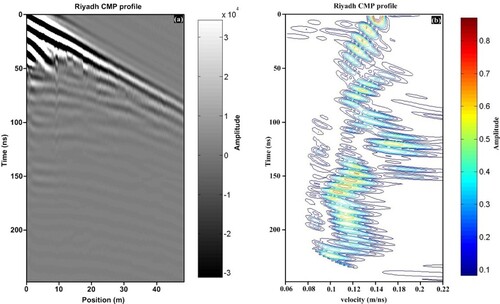
Figure 9. Two different examples of 2-D GPR processed profiles at Al-Mokattam site. The basic signal processing includes zero time-shift; background removal, bandpass filtering and running average trace. Interpretation indicates vertical fractures and irregular displacement features appearing as strong reflection patterns in 2-D GPR section.
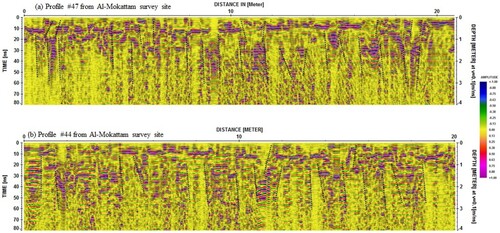
Figure 10. Three different examples of 2-D GPR processed profiles at Riyadh site. The basic signal processing includes zero time-shift; AGC, background removal, bandpass filtering and running average trace. Strong hyperbolic reflection signal probably caused by relatively large cavities structure running in subsurface rock.
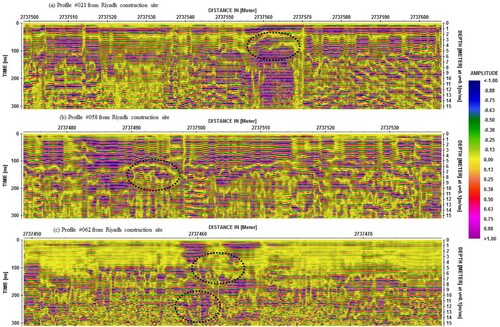
Figure 11. A composite set of time-slice images from surface to about 108 ns (corresponding to a depth of about 4.6 m). The strong reflection anomaly is related to subsurface fracture in limestone (Al-Mokattam site), where complexity and continuity of the fracture is not clearly visible in time-slice images.
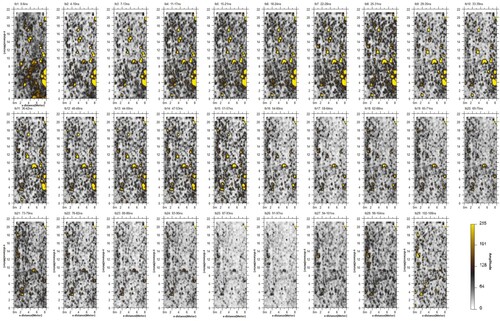
Figure 12. A composite set of time-slice images from surface to about 310 ns (corresponding to a depth of about 15 m). The strong reflection anomaly is related to subsurface cavities in limestone (Riyadh site).
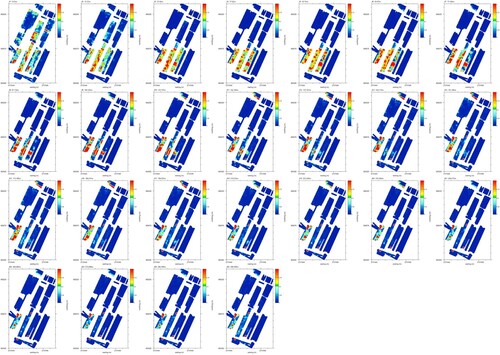
Figure 13. 3-D visualization by means of isosurface rendering technique of the trace analysis. (a) Al-Mokattam isosurface map illustrates the lateral continuity and intersection pattern of the steep fractures, where complex internal and geometry of fracture further enhanced in isosurface visualization. (b) Riyadh isosurface map, where expected subsurface cavities in limestone system cloud could be easily detected. The label (C1–C7) is given for the expected cavities location as the same in Table .
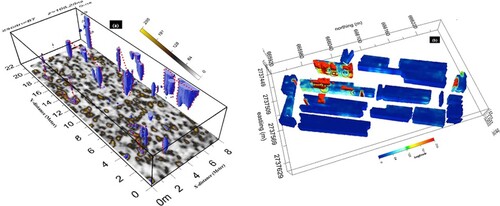
Table 2. Processing sequence applied to GPR data acquired with the RAMAC-100 MHz and the GSSI-400 MHz shielded antennas.
Figure 14. 2-D electrical resistivity section acquired with Wenner-Schlumberger configuration (Cairo site). A set of 80 electrodes with 1.5 m electrode spacing generate a 120 m profile length with about 23 m depth of complete data coverage. (a) and (b) The measured and inverted model of the electric resistivity profile, (c) its interpretation are based on resistivity values and observed fracture in the adjacent outcrop.
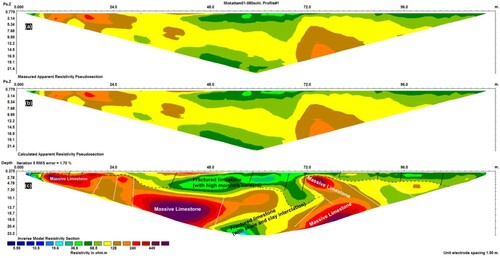
Figure 15. Overlay view between 2D electrical resistivity section and the 3-D isosurface view for GPR data demonstrate the efficiency of integration between the two techniques to image subsurface fracture at Al-Mokattam site.
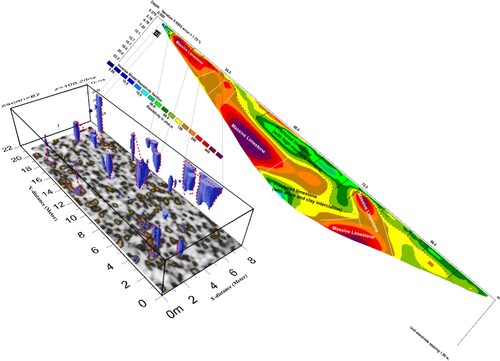
Figure 16. An isosurface rendering of the 70% strongest reflecting surface in the 3-D data cube, allowing detailed interpretation for expected cavities location at Riyadh site.
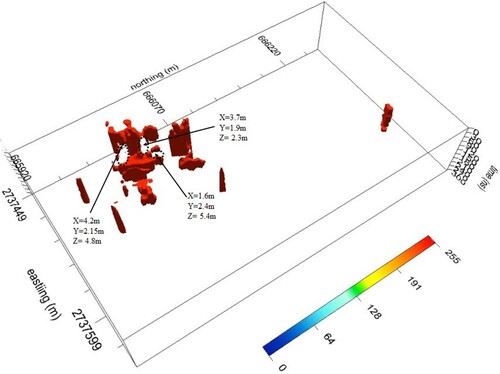
Table 3. Summary of expected location and depth for the subsurface cavities and anomalies at the Riyadh site, KSA.