
Figures & data
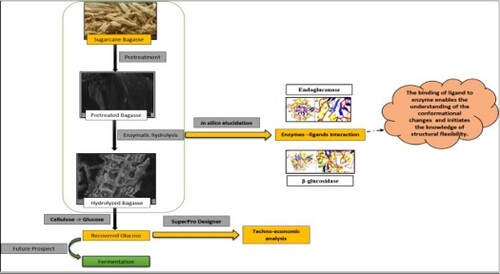
Figure 1. Overall steps considered for the study.
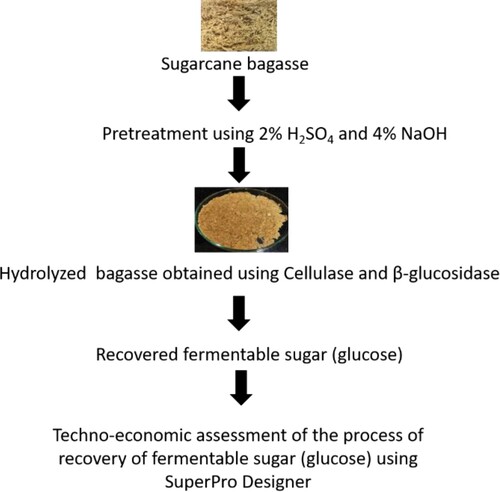
Figure 2. Structural morphology of sugarcane bagasse: (a) before hydrolysis, (b) after pretreatment and (c) after hydrolysis.
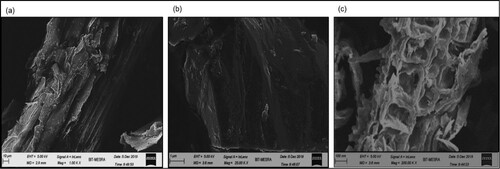
Figure 3. FTIR spectra of sugarcane bagasse: (a) before hydrolysis and (b) after hydrolysis.
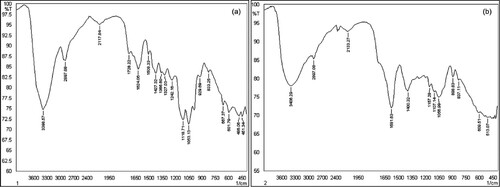
Figure 4. (a) TGA curve (b) DTA curve of sugarcane bagasse [BP – before pretreatment; AP – after pretreatment; AH – after hydrolysis].
![Figure 4. (a) TGA curve (b) DTA curve of sugarcane bagasse [BP – before pretreatment; AP – after pretreatment; AH – after hydrolysis].](/cms/asset/f05a3b4d-c23a-4074-b554-69e88abf06cb/tusc_a_2040243_f0004_oc.jpg)
Table 1. Elemental analysis of sugarcane bagasse.
Figure 5. Flow sheet for sugar recovery from sugarcane bagasse using SuperPro Designer.
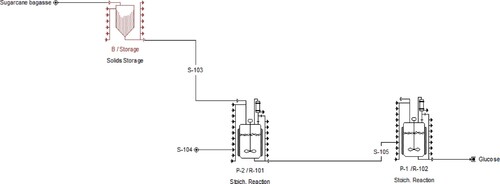
Figure 6. Cost analysis of the process obtained using SuperPro Design: (a) overall cost and (b) item cost.
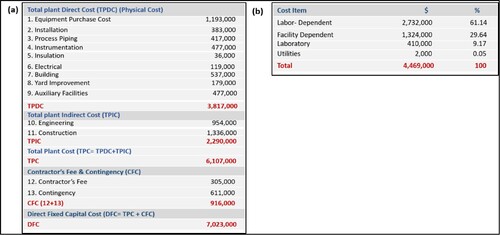
Figure 7. Cartoon representation of PBD structure: (i) Generated model viewed in Chimera (a) Endoglucanase and (b) β-glucosidase, (ii) Ligands (a) Cellulose and (b) Glucose [Yellow: Hydrogen, Blue: Oxygen, Red: Carbon], (iii) Endoglucanase (a) Chain A of 3QX3 structure for cluster 1 after docking of a molecule with the ligand using Swiss Dock and (b) The magnified image of the interaction of molecule with ligand; (iv) Beta-glucosidase (a) Chain A of 3WBE structure for cluster 5 after docking of a molecule with the ligand using Swiss Dock and (b) The magnified image of the interaction of molecule with ligand [Red colour: Coil, Yellow colour: Helix, Blue colour: Strand, Cyan colour: Ligand] obtained by Swiss Dock after docking.
![Figure 7. Cartoon representation of PBD structure: (i) Generated model viewed in Chimera (a) Endoglucanase and (b) β-glucosidase, (ii) Ligands (a) Cellulose and (b) Glucose [Yellow: Hydrogen, Blue: Oxygen, Red: Carbon], (iii) Endoglucanase (a) Chain A of 3QX3 structure for cluster 1 after docking of a molecule with the ligand using Swiss Dock and (b) The magnified image of the interaction of molecule with ligand; (iv) Beta-glucosidase (a) Chain A of 3WBE structure for cluster 5 after docking of a molecule with the ligand using Swiss Dock and (b) The magnified image of the interaction of molecule with ligand [Red colour: Coil, Yellow colour: Helix, Blue colour: Strand, Cyan colour: Ligand] obtained by Swiss Dock after docking.](/cms/asset/0ef248d4-084d-409f-83fe-6fcd61fe3095/tusc_a_2040243_f0007_oc.jpg)
Table 2. Summary of successfully produced models for endoglucanase and β-glucosidase.
Table 3. Plot statistics of the generated models using PROCHECK [A: Endoglucanase III and B: β-glucosidase].
Table 4. Poses obtained through molecular modelling using Swiss Dock.