
Figures & data
Figure 1. Geometry of the flow problem.
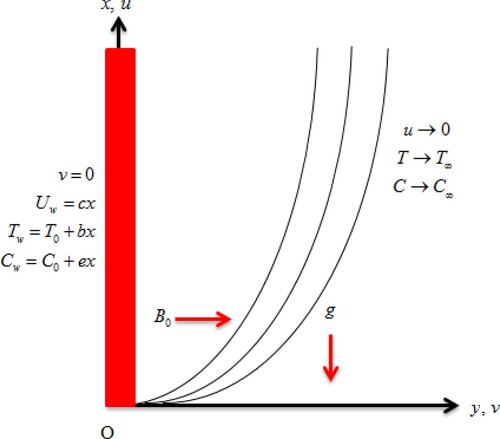
Figure 2. curves for
.
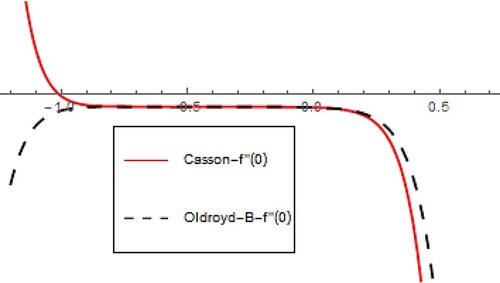
Figure 3. curves for
.
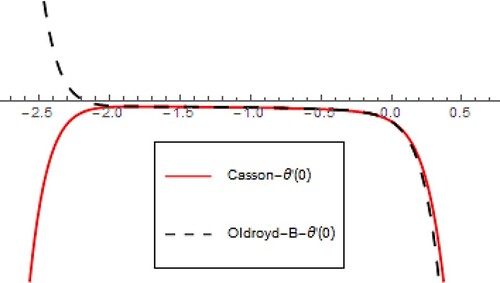
Figure 4. curves for
.
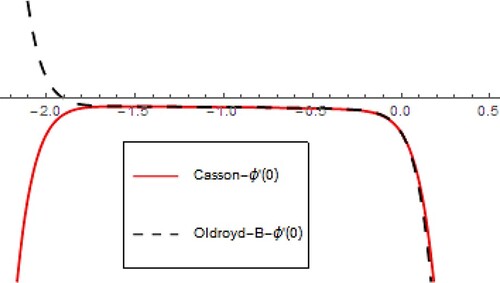
Figure 5. Influence of on
.
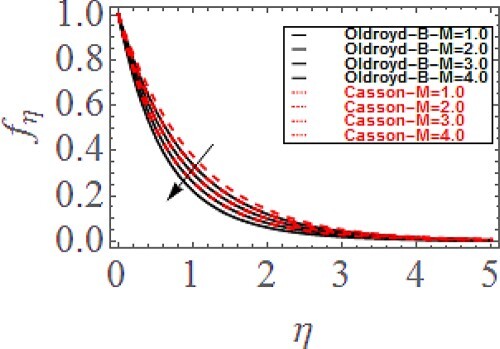
Figure 6. Influence of on
.
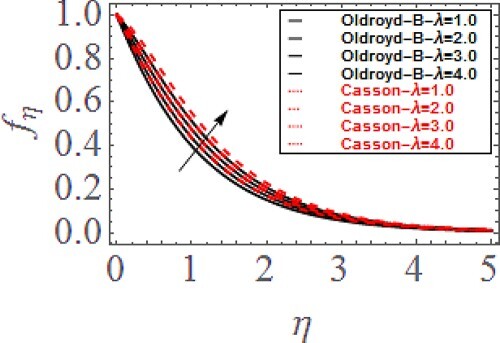
Figure 7. Influence of on
.
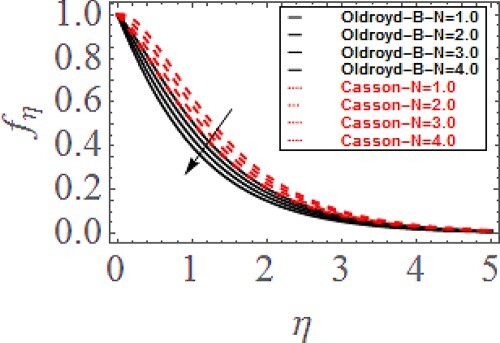
Figure 8. Influence of on
.
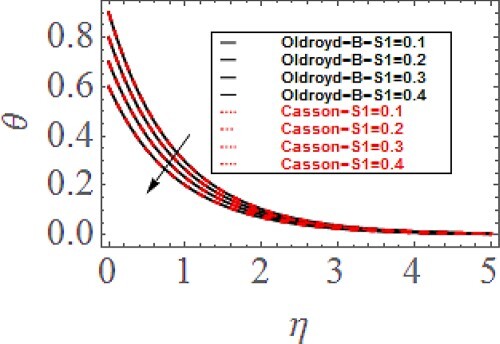
Figure 9. Influence of on
.
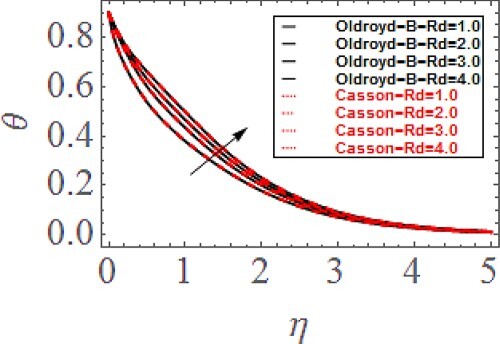
Figure 10. Influence of on
.
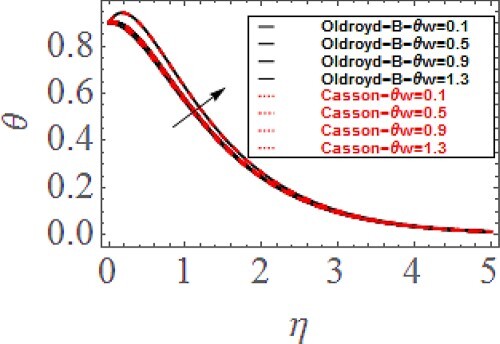
Figure 11. Influence of on
.
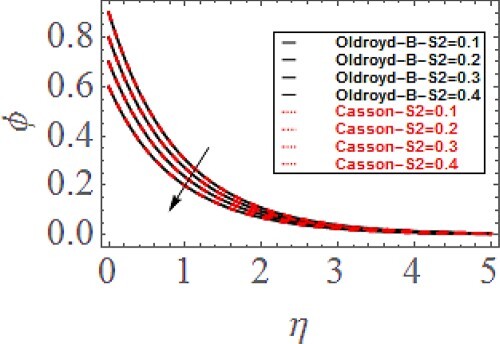
Figure 12. Influence of on
.
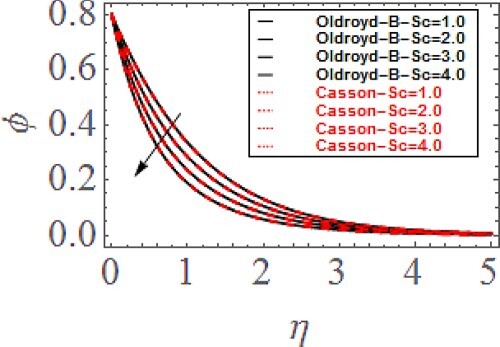
Figure 13. Influence of on
.
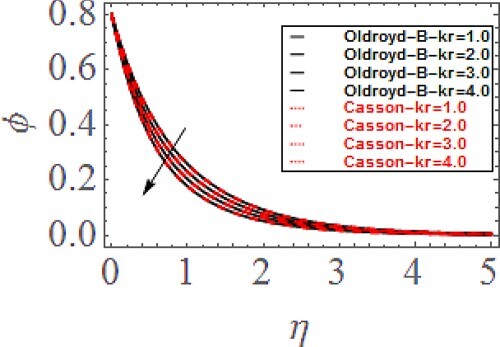
Figure 14. (a–d) Streamlines for Casson fluid when ,
,
and
.
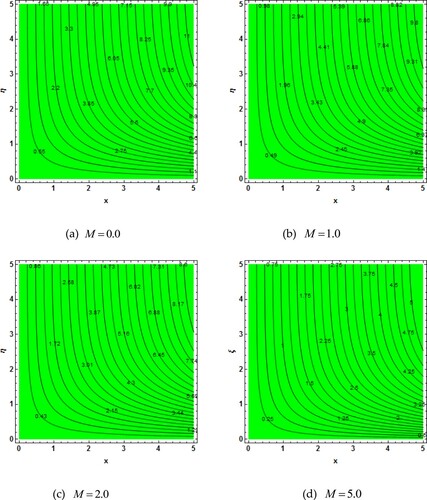
Figure 15. (a–d) Streamlines for Oldroyd-B fluid when ,
,
and
.
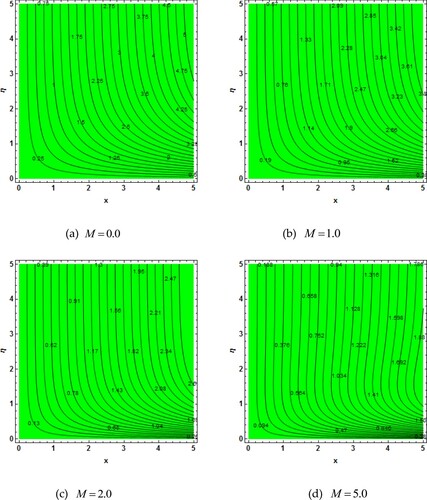
Table 1. Correlation of the current and previous outcomes.
Table 2. Physical parameters versus and
for Casson fluid.
Table 3. Physical parameters versus and
for Oldroyd-B fluid.
Data availability statement
All data used in this manuscript have been presented within the article.