
Figures & data
Figure 1. FTIR spectra of the samples.
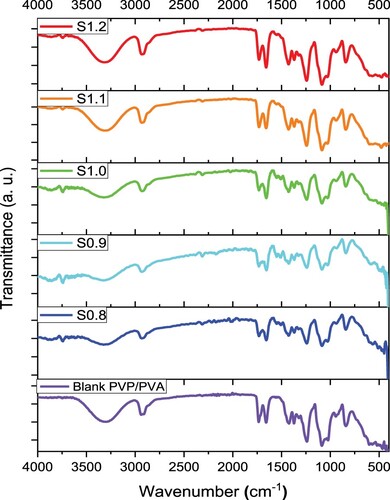
Figure 2. (a) The transmittance and (b) absorbance spectra of the samples.
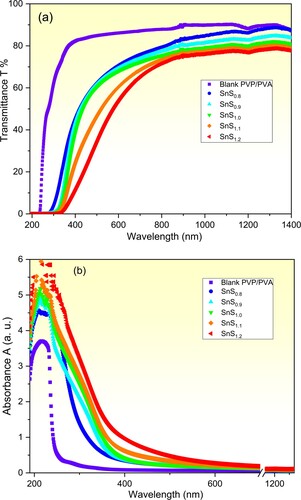
Figure 3. Plots of the absorption coefficient (a) and Tauc’s (b and c) of pure and incorporated PVP/PVA films.
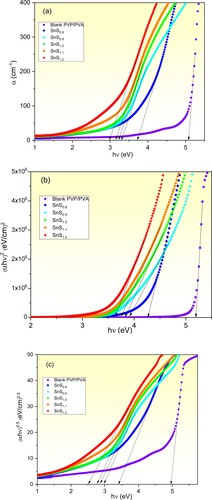
Figure 4. The dependence of Eg value of pure and incorporated PVP/PVA films on the Sn/S ratio.
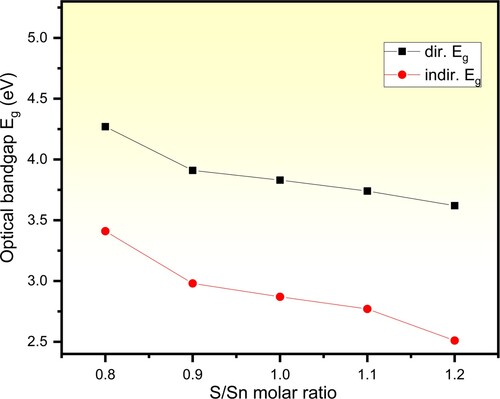
Table 1. The Eg and Eu values of pure and PVP/PVA incorporated with SnSx films.
Figure 5. Plots of ln (α) vs hν of pure and incorporated PVP/PVA films.
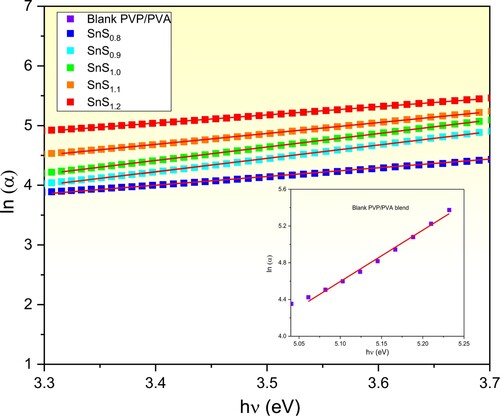
Figure 6. Plots of refractive index vs. wavelength of pure and incorporated PVP/PVA films. The inset shows n dependence on the Sn/S ratio of the filler SnS.
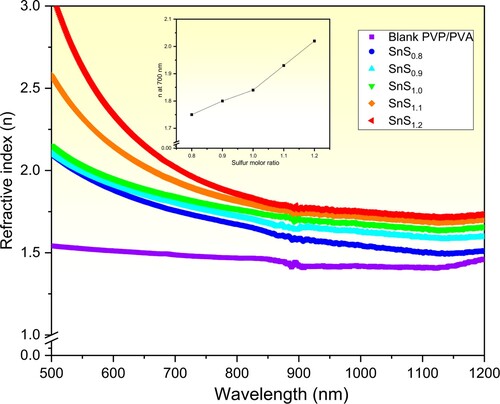
Figure 7. The dielectric permittivity (a) real and (b) imaginary parts of the pure and incorporated PVP/PVA films vs. λ.
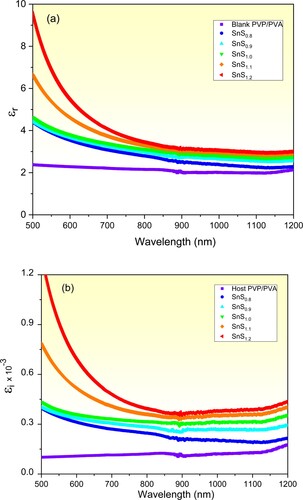
Figure 8. Plots of (a) (n2-1)−1 vs. (hν)2, (b) (n2-1)−1 vs. λ−2 and (c) n2 vs. λ2 of of the pure and incorporated PVP/PVA films.
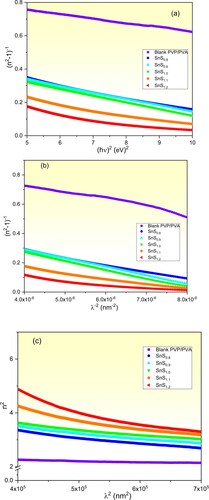
Table 2. The optical properties of pure and incorporated PVP/PVA films.
Figure 9. PL spectra of pure and incorporated PVP/PVA films.
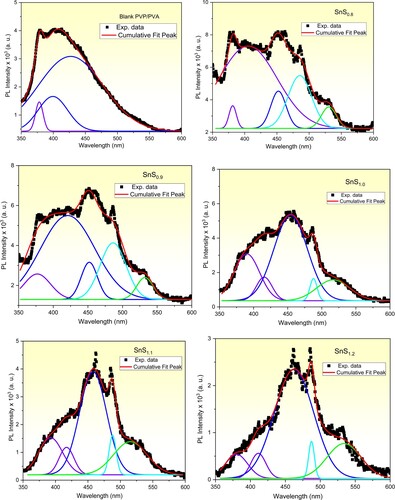
Figure 10. A schematic diagram of the electronic transitions and emissions of (a) pure and (b) SnSx incorporated PVP/PVA blends.
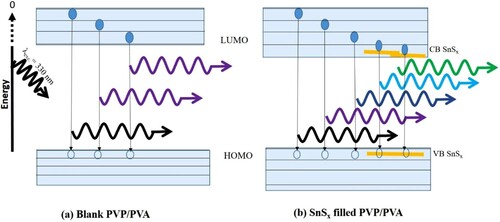
Table 3. PL peaks positions of SnSx incorporated PVP/PVA blends.