
Figures & data
Figure 1. Plot of the RE for the IW distribution.
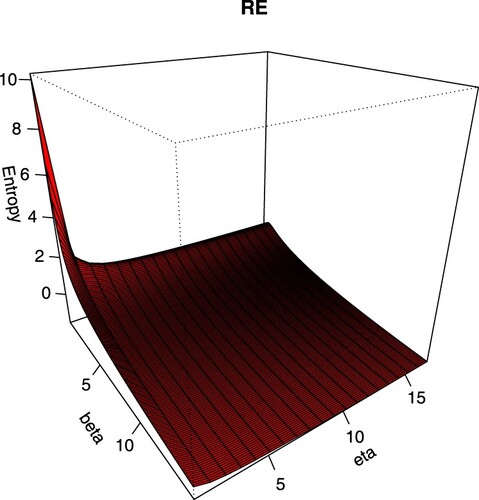
Figure 2. Plot of the QE for the IW distribution.
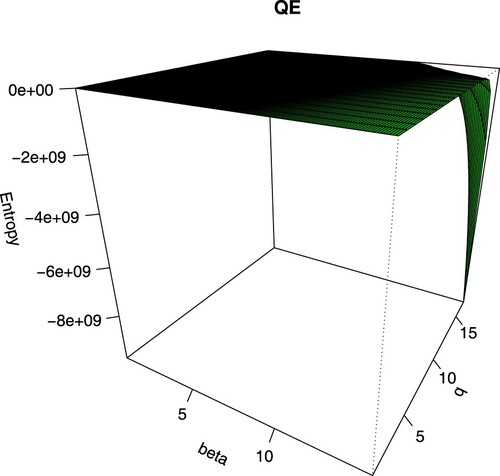
Figure 3. Plot of the SE for the IW distribution.
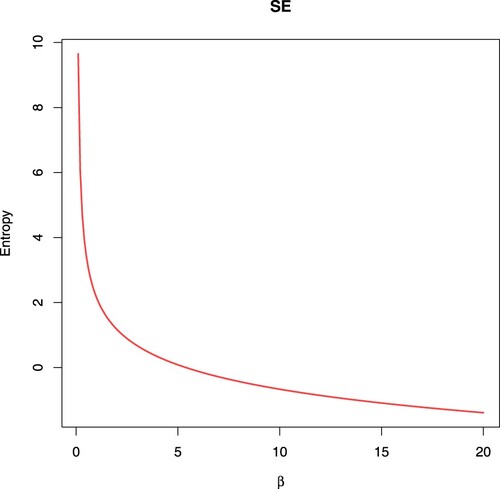
Table 1. Average RMSEs and RABs (in parentheses) of ,
and
for
.
Table 2. Average RMSEs and RABs (in parentheses) of ,
and
for
.
Table 3. The ACLs of ,
and
with their CPs in parentheses, when
.
Table 4. The ACLs of ,
and
with their CPs in parentheses, when
.
Table 5. The real data sets.
Table 6. MLEs (with SEs in parentheses) and goodness of fit statistics for the real data.
Table 7. Different generated PT-IIC samples.
Table 8. The MLEs and MPSEs (with their SEs in parentheses) for the real data.
Table 9. The ACIs (with confidence lengths in parentheses) for the real data.