Figures & data
Figure 1. The measured and simulated PDD curves of the 10 MV photon beam using different electron energies (MeV) with the γ test using the 1%/1 mm criteria.
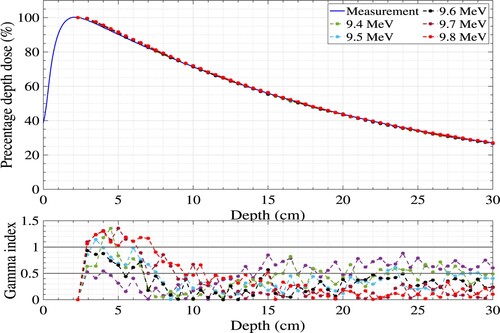
Table 1. PDD comparison using a gamma index (GI) with two criteria sets, 2%/2 mm and 1%/1 mm, for various monoenergetic energies (MeV).
Figure 2. The measured and simulated dose profiles of the 9.6 MeV beam for a 10 × 10 cm field size at a depth of 2.3 cm using a circular focal spot with various FWHM values.
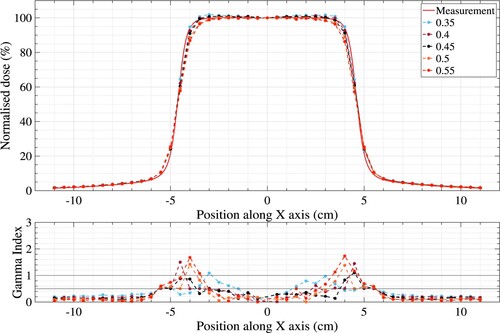
Table 2. Dose profile comparison using gamma index (GI) with two criteria sets, the 2%/2 mm and 1%/1 mm, using a circular focal spot with various FWHMs (cm).
Figure 3. The measured and simulated dose profiles for a 9.6 MeV energy with an FWHM of 0.45 cm, in both directions, for a 10 × 10 cm field size using different mean angular divergences.
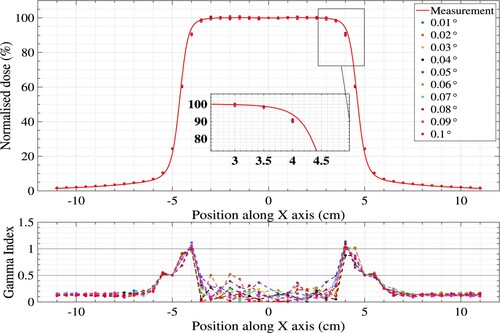
Figure 4. The measured and simulated dose profiles of the 9.6 MeV with an FWHM of 0.45, in both directions, and mean angular divergence of 0.04 for a 10 × 10 cm
field size at different depths.
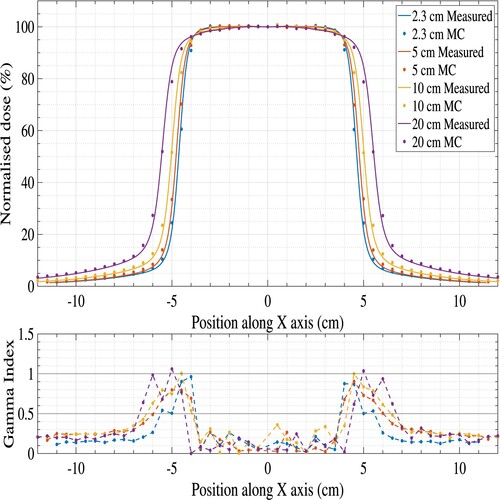
Table 3. Dose profile comparison using gamma index (GI) with two criteria sets, 2%/2 mm and 1%/1 mm, using a circular focal spot with an FWHM of 0.45 cm with different mean angular divergences.
Table 4. Output factor differences between the measurements and fine-tuned MC model for different field sizes.
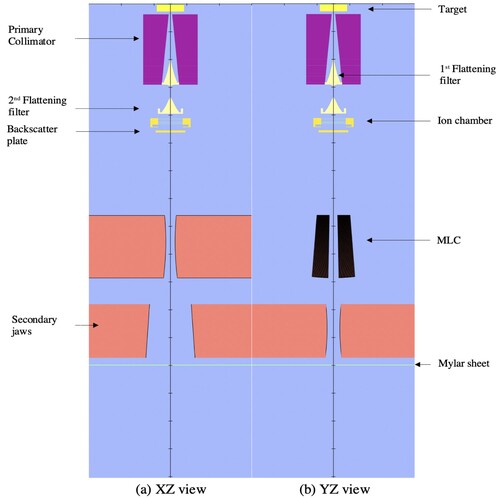
Figure A1. Components of the MC model of the linac head from two different viewpoints.