Figures & data
Table 1. Description of the five wounded rat groups (n = 6/group).
Table 2. Sequence of WNT4, MMP9, TGFB1, 5srRNA, CTNNB1, and actin primers.
Figure 1. Wound healing in the five rat groups. A: Curve showing the duration (days, X-axis) of wound-healing diameter (mm ± SD, Y-axis). Each group contained six rats. B: images of a representative rat from each group on the 1st (i–v), 13th (vi–x) and 25th (xi–xv) days.
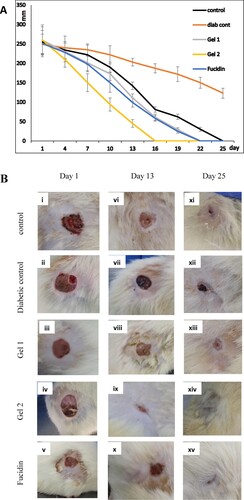
Table 3. Fasting blood glucose (mg/dL) for the five rat groups.
Table 4. Biochemistry profile for all groups on day 1.
Table 5. Biochemistry profile of all groups on day 13.
Table 6. Biochemistry profile of all groups on day 25.
Figure 2. The expression of WNT4, MMP9, TGFB1, 5srRNA and CTNNB1 in different rat groups on day 25. Data are represented as mean ± SD (n = 3, two independent experiments). The results are expressed as fold-change compared to the untreated group (1-fold change: G1). The raw delta-Ct values (the difference between CT values obtained for the gene of interest and the housekeeping gene) were converted into relative expression levels (fold-change) using the formula 2−ΔΔCt. Statistical differences, compared to untreated control cells, were assessed using a one-way ANOVA with Tukey’s posthoc multiple comparison test. p < 0.05 (*) and p < 0.01 (**) were taken as significant.
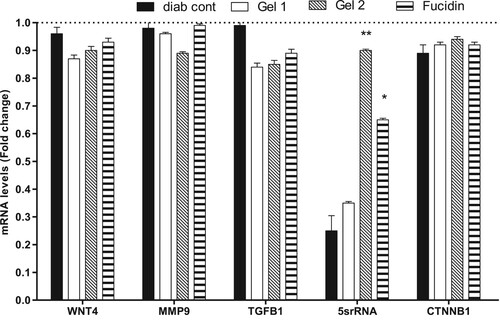
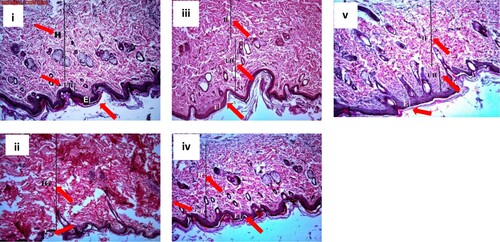
Figure 3. Sections of wound tissues stained with haematoxylin and eosin. i: control group 1, ii: diabetic control group 2, iii: Gel 1 group 3, iv: Gel 2 group 4, v: Fucidin group 5. Red arrows: E: epidermis, H: healed tissue, UH: unhealed tissue, IG: immature granulation tissue. The thickness of each layer is indicated by a vertical line. The diabetic tissue has only immature granulation tissue.