Figures & data
Figure 1. Pictures of Nigella sativa: (A) Plant, (B) Seeds and (C) Extracted oil.
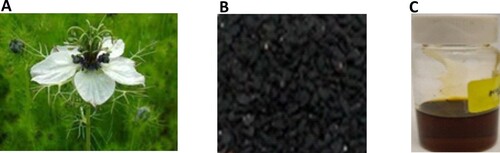
Figure 2. Absorption spectra of for Nigella sativa seed oil extract collected from Saudi Arabia.
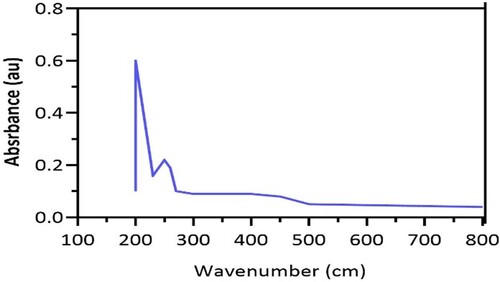
Table 1. The yield and antioxidant activities of Nigella sativa seed oil using TPC, DPPH, and FRAP assays.
Figure 3. Total Phenolic Content (TPC) of Nigella sativa seed oil using different solvents.
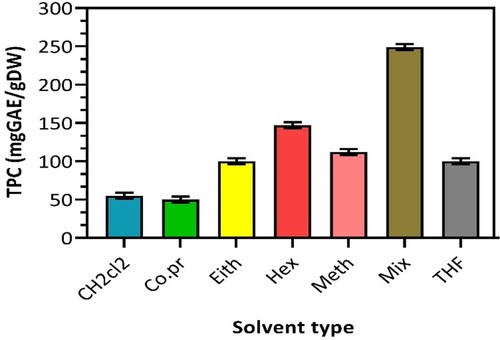
Figure 4. Effect of different solvents on inhibition of Nigella sativa seed oil using 2,2-Diphenyl-1-Picrylhydrazyl (DPPH).
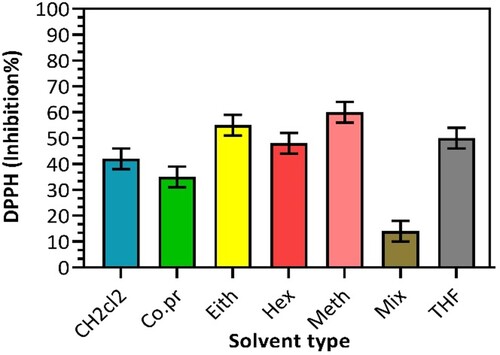
Figure 5. Effect of different solvents on Nigella sativa seed oil using Radical Scavenging Activity (FRAP).
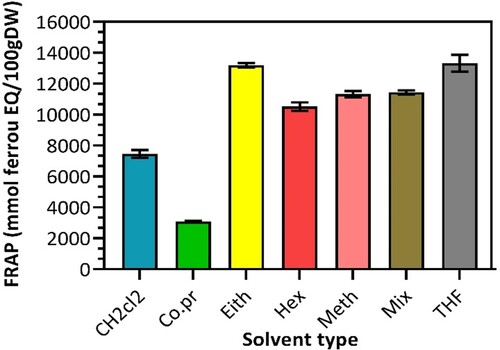
Table 2. ANOVA results for TPC, DPPH, and FRAP.
Figure A1. The standard calibration curve of Gallic acid was separately obtained by plotting the absorbance versus concentrations (0–40 µg/mL) used for TPC test.
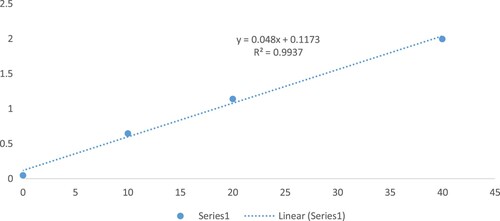
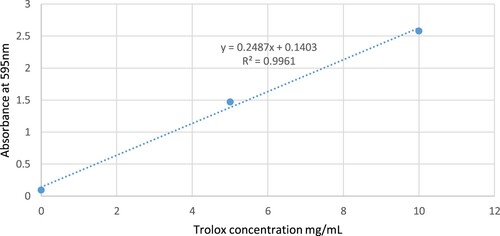
Figure A2. The standard calibration curve of Trolox was separately obtained by plotting the absorbance versus concentrations (0–15 mg/mL) used for DPPH assay.
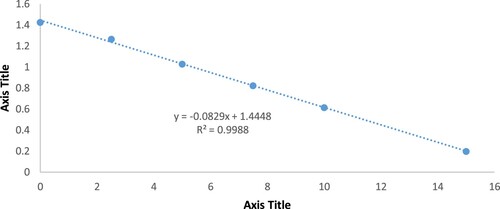
Figure A3. The calibration curve of Fe2+ with linearity range of 0–10 µM used for FRAP assay.