
Figures & data
Figure 1. XRD pattern of pure and doped Pb1−4.75xNd0.5xNi4xZrO3 nanocrystals.
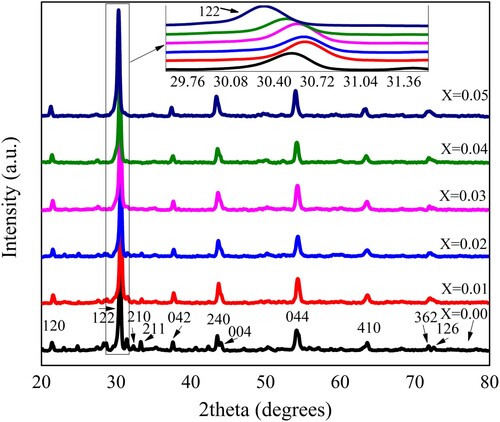
Table 1. Physical parameters of Pb1−4.75xNd0.5xNi4xZrO3 nanocrystals determined from XRD data.
Figure 2. The variation in the crystallite size and crystal cell volume of Pb1−4.75xNd0.5xNi4xZrO3 nanocrystals with respect to doping concentration.
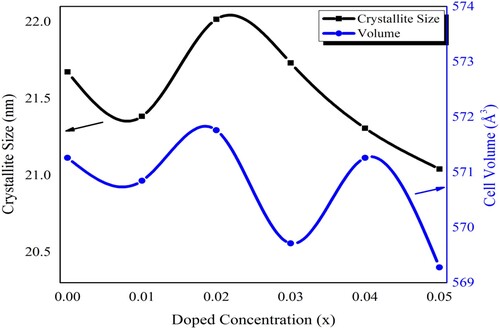
Figure 3. Variation in the X-ray density, bulk density, and porosity of Pb1−4.75xNd0.5xNi4xZrO3 nanocrystals with the doping contents.
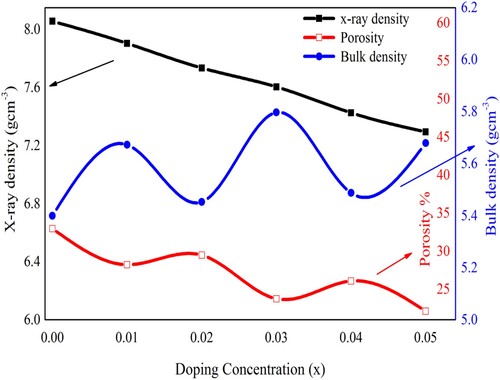
Figure 4. Fourier transforms infrared (FTIR) spectroscopy of pure and doped Pb14.75xNd0.5xNi4xZrO3 nanocrystals.
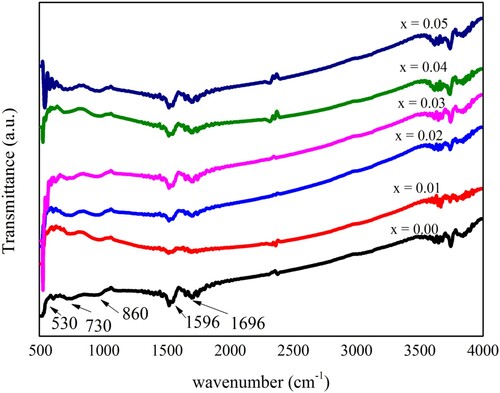
Figure 5. SEM image and histogram of particle size distribution of Nd3+ and Ni2+ ions substituted Pb14.75xNd0.5xNi4xZrO3 nanocrystals synthesized by the micro-emulsion method.
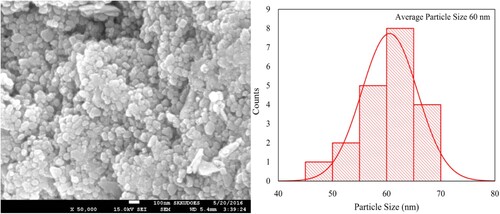
Figure 6. The dielectric constant of Pb1−4.75xNd0.5xNi4xZrO3 nanocrystals with respect to frequency.
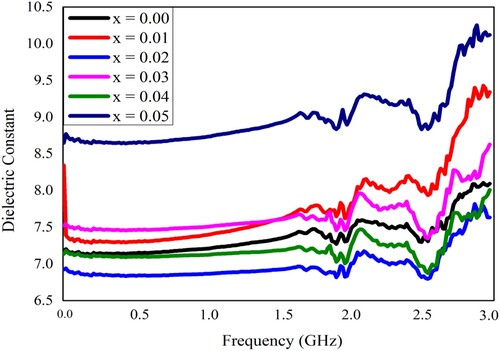
Figure 7. The frequency-dependent dielectric loss factor of Pb1−4.75xNd0.5xNi4xZrO3 nanocrystals.
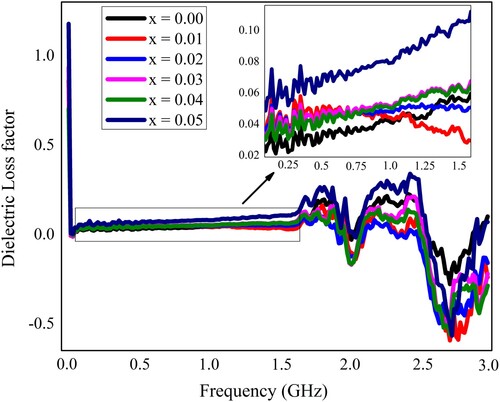
Figure 8. The frequency-dependent tangent loss of Pb1−4.75xNd0.5xNi4xZrO3 nanocrystals.
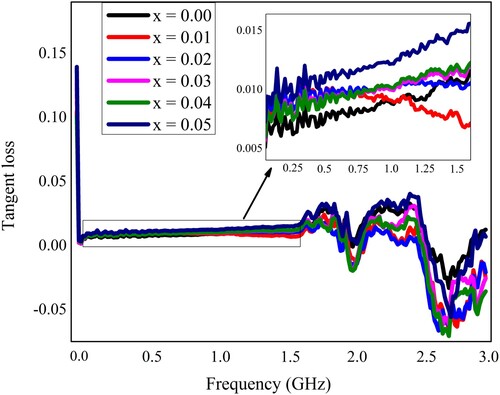
Figure 9. The frequency-dependent ac conductivity of Pb1−4.75xNd0.5xNi4xZrO3 nanocrystals.
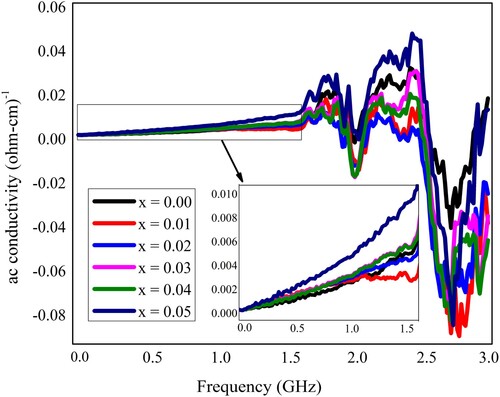
Table 2. Various dielectric parameters and ac conductivity for “Pb1−4.75xNd0.5xNi4xZrO3” nanocrystals at some selected frequencies.
Figure 10. The ac conductivity of Pb1−4.75xNd0.5xNi4xZrO3 nanocrystals with respect to doping concentration.
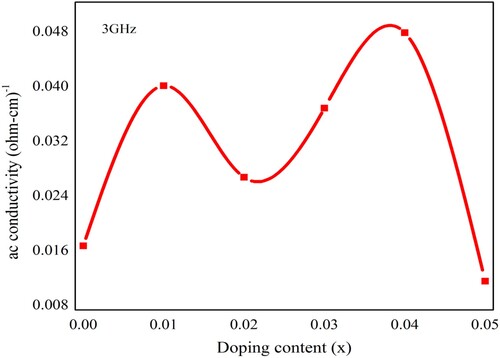
Figure 11. The current–voltage (I–V) characteristics of all the samples of Pb1−4.75xNd0.5xNi4xZrO3 nanocrystals.
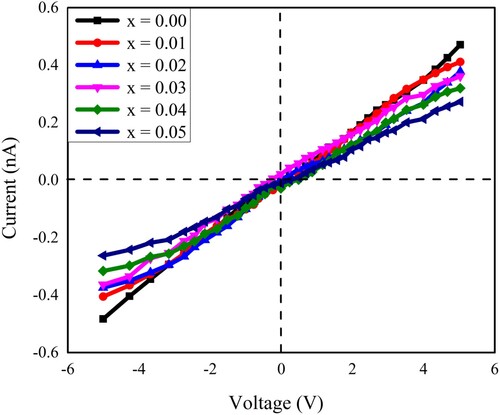
Figure 12. The variation in the dc-electrical resistivity of Pb1−4.75xNd0.5xNi4xZrO3 nanocrystals due to doping concentration.
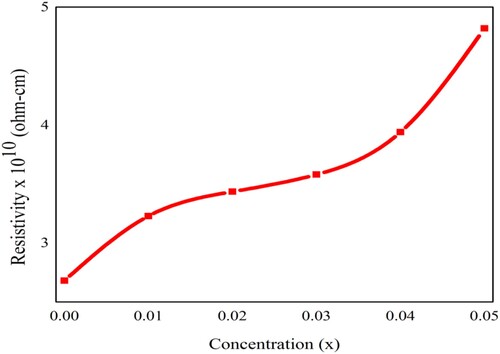
Table 3. Different values of the DC-electrical resistivity and other related results of lead zirconate Pb1−4.75xNd0.5xNi4xZrO3 nanocrystals due to different doping concentrations.