Figures & data
Table 1. Parameters of the IM.
Table 2. VUF and the three-phase supply voltages for different types of voltage unbalance.
Table 3. Harmonic content in the supply voltage.
Table 4. VUF and THDV of the selected scenarios.
Figure 1. The average THDI of the stator current with VUF.
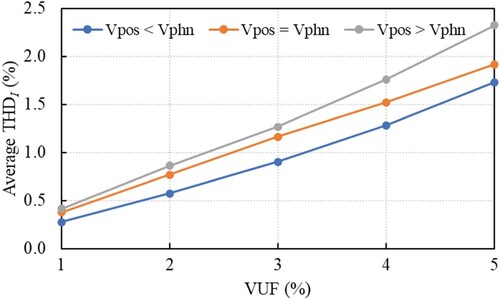
Figure 2. The amplitude of torque oscillations due to voltage unbalance.
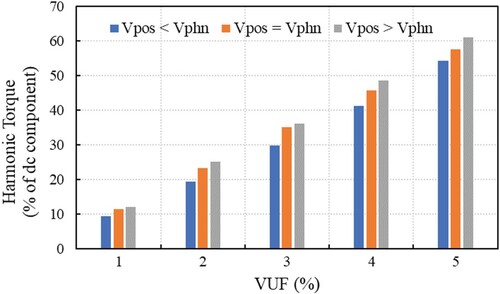
Figure 3. PF of the IM due to voltage unbalance.
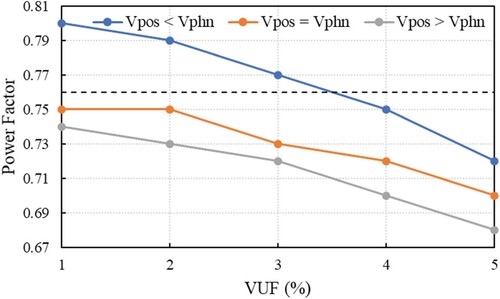
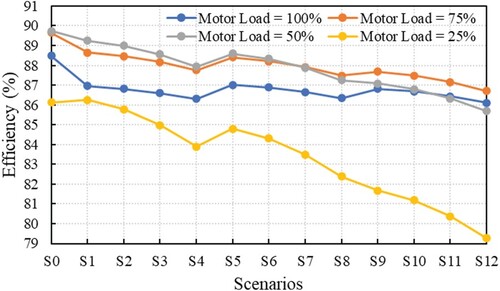
Figure 4. The efficiency of the IM due to voltage unbalance.
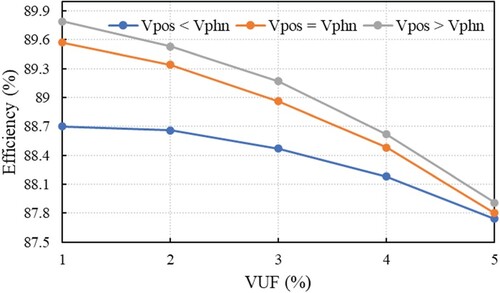
Figure 5. THDI of the stator current with harmonic content and THDV.
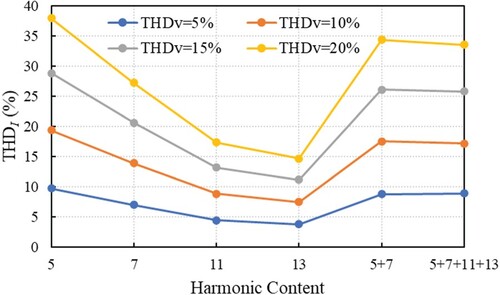
Table 5. The values of the ratio Ih% / Vh% related to the harmonic voltage order.
Figure 6. The amplitude of the torque oscillations with harmonic content and THDV.
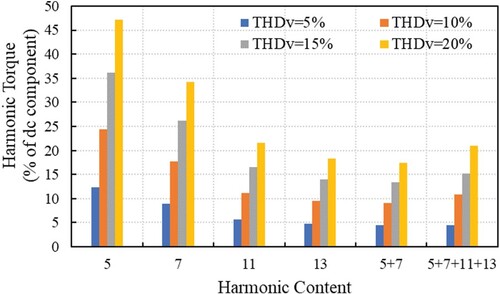
Figure 7. Harmonic spectrum for the amplitudes of the electromagnetic torque, voltage, and stator current.
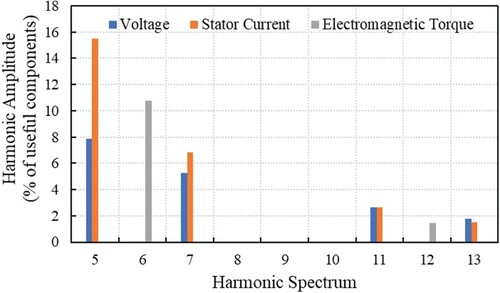
Figure 8. PF of the IM versus harmonic content and THDV.
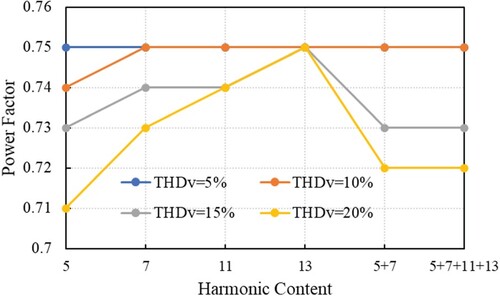
Figure 9. The efficiency of the IM versus harmonic content and THDV.
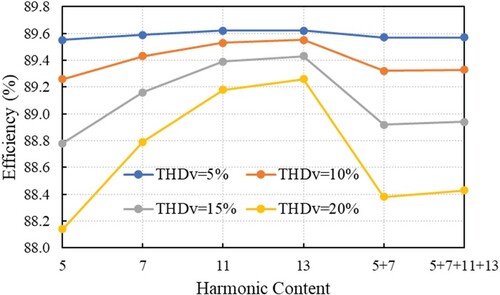
Figure 10. The Average THDI of the stator current under voltage unbalance and harmonics scenarios.
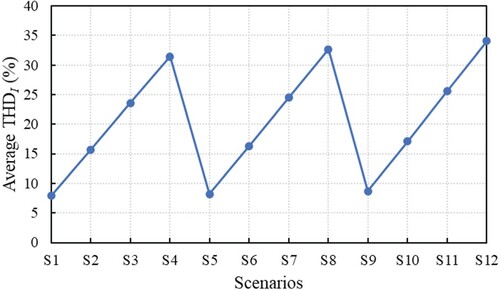
Figure 11. Harmonic spectrum of the stator current, for VUF = 3% and THDV = 10%, when in the voltage are present harmonics of both 5th and 7th orders.
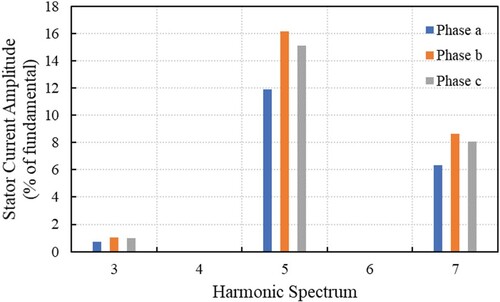
Figure 12. The amplitude of the torque oscillations under voltage unbalance and harmonics scenarios.
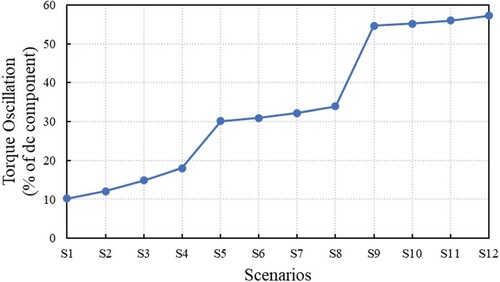
Figure 13. Harmonic spectrum of the stator current, voltage, and electromagnetic torque, for VUF = 3% and THDV = 10%, when in the voltage are present harmonics of both 5th and 7th orders.
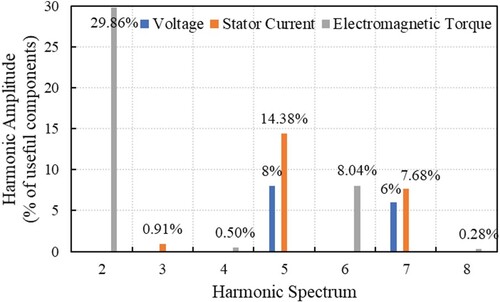
Figure 14. PF of the IM under voltage unbalance and harmonics scenarios.
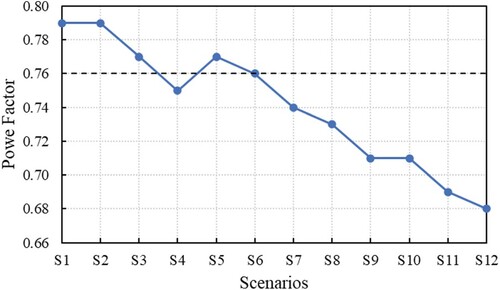
Figure 15. The efficiency of the IM under voltage unbalance and harmonics scenarios.
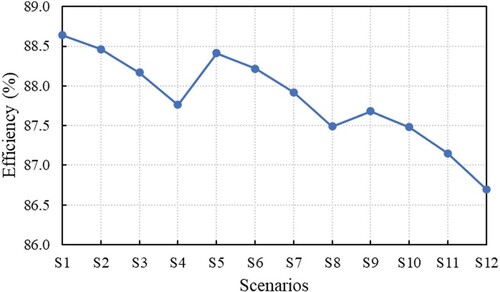
Figure 16. THDI of the stator current under voltage unbalance and harmonics scenarios, at different load percentages.
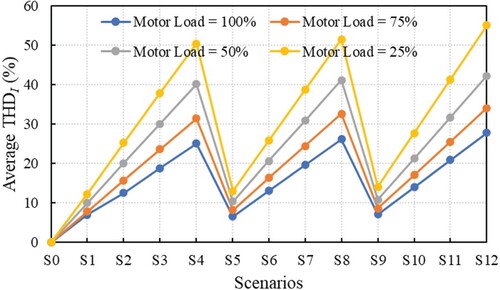
Figure 17. The amplitude of the torque oscillations under voltage unbalance and harmonics scenarios, at different load percentages.
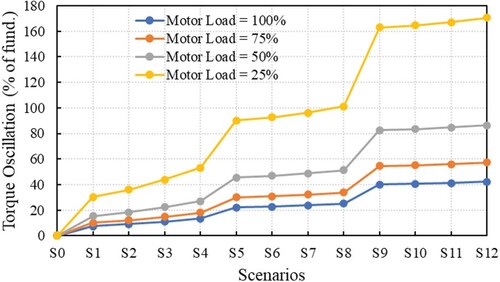
Figure 18. PF of the IM under voltage unbalance and harmonics scenarios, at different load percentages.
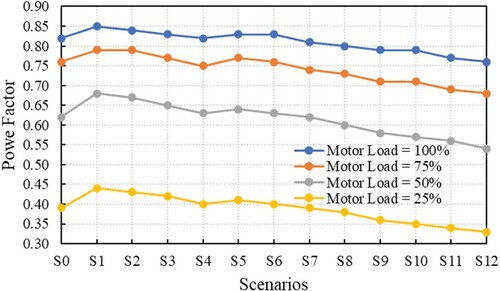
Figure 19. The efficiency of the IM under voltage unbalance and harmonics scenarios, at different load percentages.