
Figures & data
Table 1. Optimized procedures for the synthesis of 8-hydroxy-3,6-disulphonaphthyl azohydroxynaphthalenes (3a–e).
Figure 1. 13C NMR peaks of 3a–e in DMSO-d6.
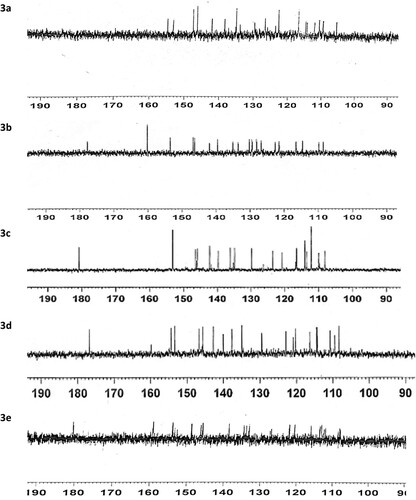
Figure 2. Peak splits in the aromatic protons of 3b.
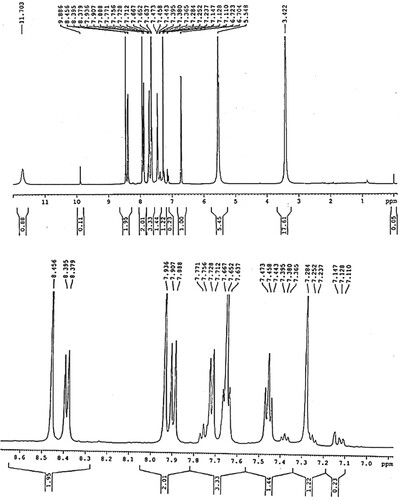
Figure 3. 1H NMR of 3c and 3d showing highly deshielded protons of the hydrazone tautomers.
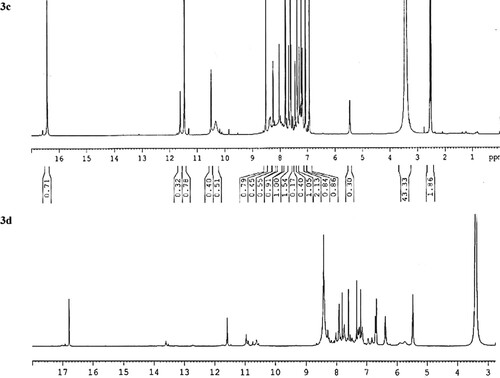
Figure 4. Effect of pH on azo-hydrazone tautomers of 3a–e at concentrations.
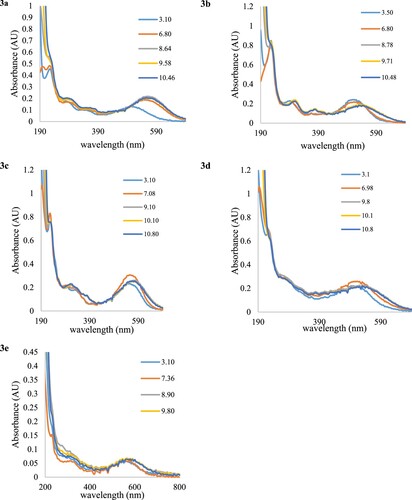
Figure 5. Electronic absorption spectra of the five dyes in (a) ethanol, (b) acetonitrile, (c) acetone, (d) ethyl acetate, (e) DMF at concentrations.
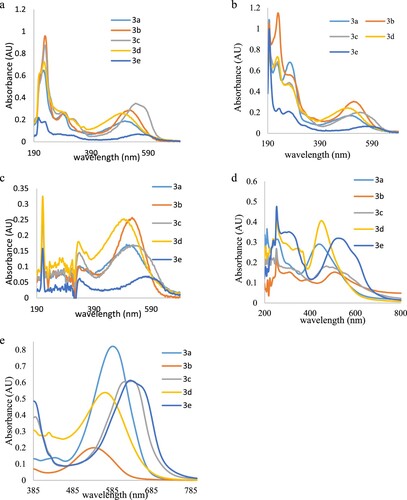
Table 2. Colours of the dyes in various solvents.
Table 3. Variation of the molar transition energies of the dyes with Kamlet–Taft parameters of solvents.
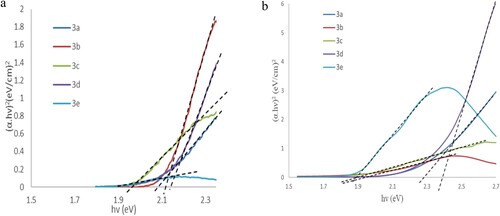
Figure 6. Tauc’s plots of 3a–e in (a) acetone and (b) ethyl acetate.
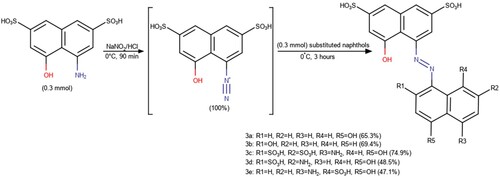
Scheme 1. Synthesis of 8-hydroxy-3,6-disulphonaphthyl azohydroxynaphthalenes (3a–e) with yields.
Scheme 2. Azo-hydrazone tautomerism of 3a–e.
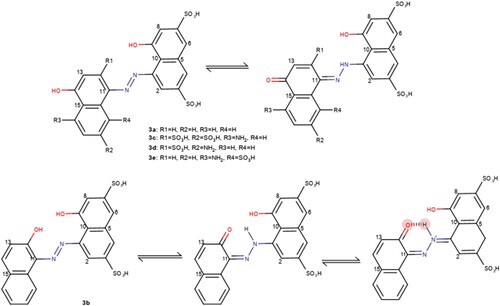
Table 4. Multiple linear regression analysis of the KAT equations for molar transition energies of the dye probes.