
Figures & data
Figure 1. Location map of the study area; image provided by Google Earth.
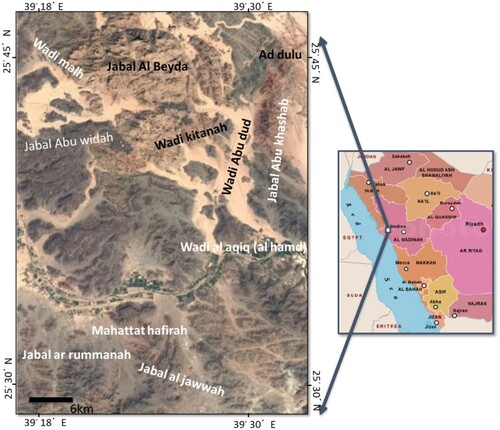
Figure 2. Geologic map of the studied district; Modified after pellaton [Citation11].
![Figure 2. Geologic map of the studied district; Modified after pellaton [Citation11].](/cms/asset/0f6f6c12-fc51-4963-b0e4-582ec17980cf/tusc_a_2077615_f0002_oc.jpg)
Table 1. Lithostratigraphic units in the Al Bayda area.
Figure 3. The main geologic features of Al Bayda granites; (a) general view of the studied granites; (b) NW trending NFS cutting through Al Bayda granite; (c) Al Bayda granitic exfoliation; (d) The contact between the studied granites and Neogene basaltic rocks; (e) Altered granites and alteration sites. Gr = Granite & Bs = Basalt.
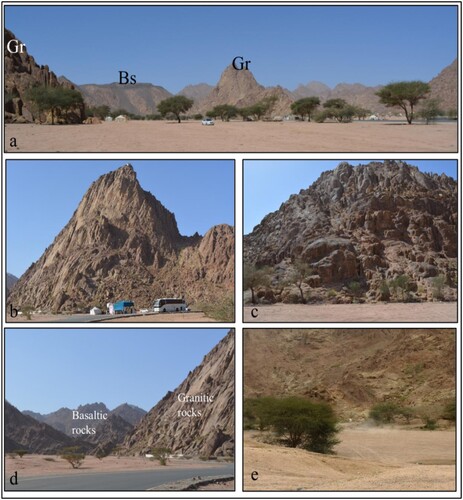
Figure 4. The modal analysis of the studied granites on the ternary diagram of Streckeisen [Citation15].
![Figure 4. The modal analysis of the studied granites on the ternary diagram of Streckeisen [Citation15].](/cms/asset/01cf5806-f83a-49ca-93fa-3a9957382b29/tusc_a_2077615_f0004_ob.jpg)
Table 2. The modal analyses (mineral %) of the studied alkaline granites.
Figure 5. Photomicrographs showing alkali feldspar granite essential, accessory, and opaque minerals and their mutual relationships.
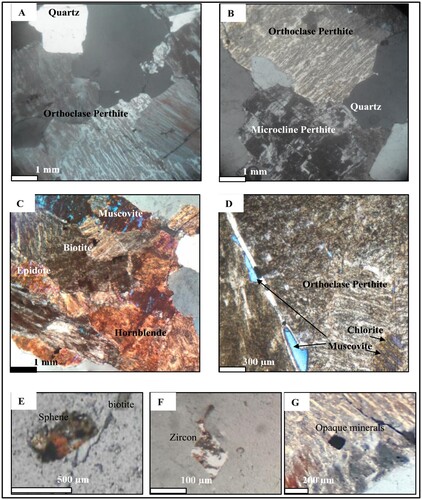
Figure 6. Photomicrographs showing peralkaline granite essential, accessory, and opaque minerals and their mutual relationships.
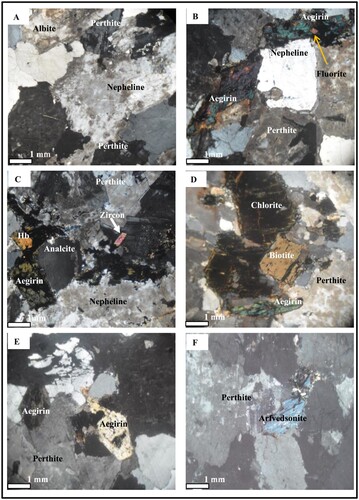
Figure 7. Photomicrographs showing altered muscovite granite essential, accessory, and opaque minerals and their mutual relationships.
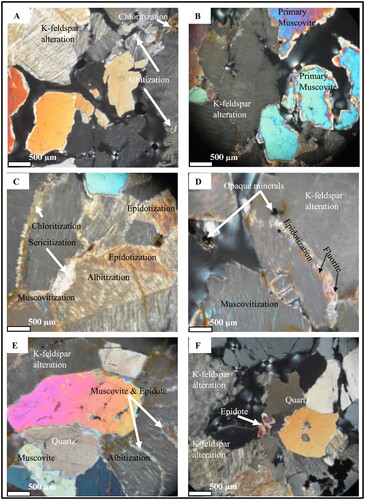
Figure 8. Photomicrographs showing the pegmatite-aplite sheet rock-forming minerals and their mutual relationships.
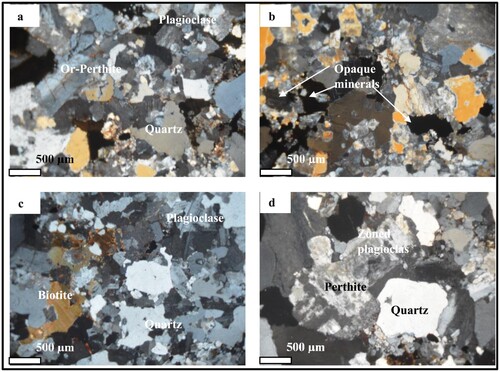
Figure 9. Variation diagrams of selected major and trace elements of Al Bayda fresh and altered younger granitoid rocks.
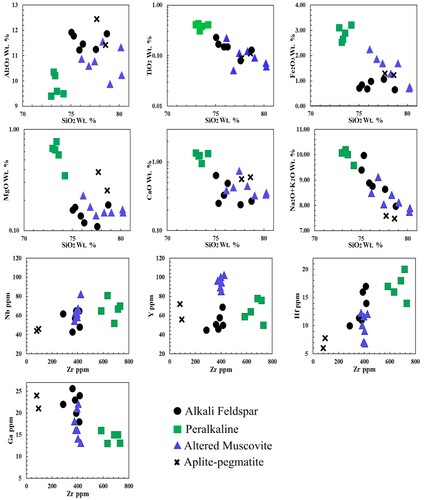
Table 3. Major (wt.%) and trace elements (ppm) abundance in Al Bayda fresh and altered granitoids.
Figure 10. Classification, Magma type and tectonic setting of the studied granites. (a) Middlemost, [Citation18], (b) Batchelor & Bowden [Citation19], (c) Rickwood [Citation20], (d) Agapitic index (AI) vs. SiO2 diagram [Citation21]. The post-collision granite field is added by Farahat et al., [Citation22]., (e) Maniar and Piccoli [Citation23], (f&g) Whalen et al., [Citation24], (h) Pearce et al., [Citation25], VAG-volcanic arc granite, syn-COLG-syn collision granite, ORG-oceanic ridge granite, WPG-within plate granite. Symbols as Figure (9).
![Figure 10. Classification, Magma type and tectonic setting of the studied granites. (a) Middlemost, [Citation18], (b) Batchelor & Bowden [Citation19], (c) Rickwood [Citation20], (d) Agapitic index (AI) vs. SiO2 diagram [Citation21]. The post-collision granite field is added by Farahat et al., [Citation22]., (e) Maniar and Piccoli [Citation23], (f&g) Whalen et al., [Citation24], (h) Pearce et al., [Citation25], VAG-volcanic arc granite, syn-COLG-syn collision granite, ORG-oceanic ridge granite, WPG-within plate granite. Symbols as Figure (9).](/cms/asset/85560d79-1dd4-4f9d-9b07-7a083d63aa8d/tusc_a_2077615_f0010_oc.jpg)
Figure 11. (a) Anorogenic and post-orogenic A-type granite discrimination diagram, Eby [Citation28]. (b) Granitic source binary diagram, modified after Altherr et al. [Citation30]. Symbols as Figure (9).
![Figure 11. (a) Anorogenic and post-orogenic A-type granite discrimination diagram, Eby [Citation28]. (b) Granitic source binary diagram, modified after Altherr et al. [Citation30]. Symbols as Figure (9).](/cms/asset/ede9e7dc-812c-4953-bda2-13d00cafa3e0/tusc_a_2077615_f0011_oc.jpg)
Figure 12. Chondrite-normalized multi-elements diagram for the studied granites. Normalizing values from Sun and McDonough [Citation32]. Symbols as Figure (9).
![Figure 12. Chondrite-normalized multi-elements diagram for the studied granites. Normalizing values from Sun and McDonough [Citation32]. Symbols as Figure (9).](/cms/asset/c0dff339-4ad5-4d14-9843-3529ccc4ced4/tusc_a_2077615_f0012_oc.jpg)
Figure 13. Primitive mantle-normalized multi-elements diagrams for the studied granite. Normalizing values from Sun and McDonough [Citation32]. Symbols as Figure (9).
![Figure 13. Primitive mantle-normalized multi-elements diagrams for the studied granite. Normalizing values from Sun and McDonough [Citation32]. Symbols as Figure (9).](/cms/asset/30fc7e8f-0b39-4c19-a271-29f7e06502b8/tusc_a_2077615_f0013_oc.jpg)