
Figures & data
Scheme 1. Schematic illustration of electrode preparation.
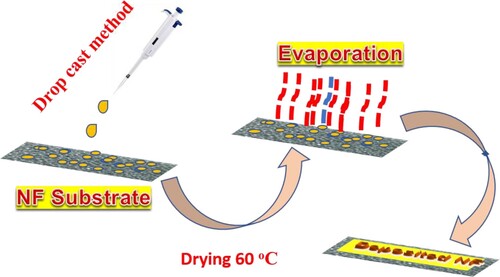
Figure 1. Scanning electron microscopy images of (a) Ce-MOF and (b) Ce-MOF-NH2 and EDS spectrum of (c) Ce-MOF/ NF and (d) Ce-MOF-NH2/ NF.
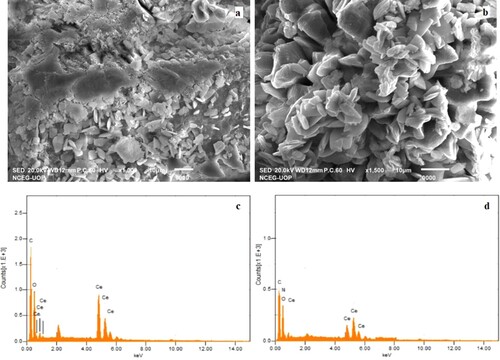
Figure 2. Atomic force microscopy images of (a) Ce-MOF/NF and (b) Ce-MOF-NH2NF and particle size distribution of (c) Ce-MOF/NF and (d) Ce-MOF-NH2/NF.
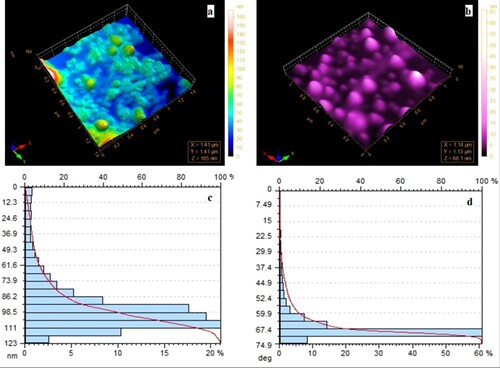
Figure 3. (a) XRD and (b) FTIR of Ce-MOF/ NF and Ce-MOF-NH2/ NF.
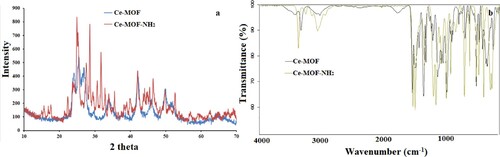
Figure 4. (a) CV, (b) LSV, (c) Tafel slope, and (d) electrochemical impedance spectroscopy of bare NF, Ce-MOF/NF, and Ce-MOF-NH2/NF, respectively.
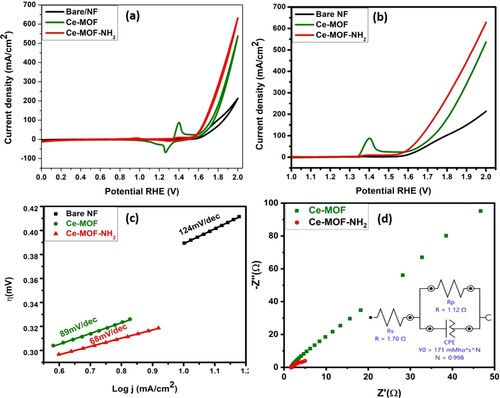
Table 1. Comparative study for all synthesized electrodes.
Figure 5. (a) non-faradic CV curves at different scan rates, (b) double-layer capacitance calculated via delj vs. scan rate of Ce-MOF/NF, (c) non-faradic CV curves at different scan rates, (d) double-layer capacitance calculated via delj vs. scan rate of Ce-MOF-NH2/NF, respectively.
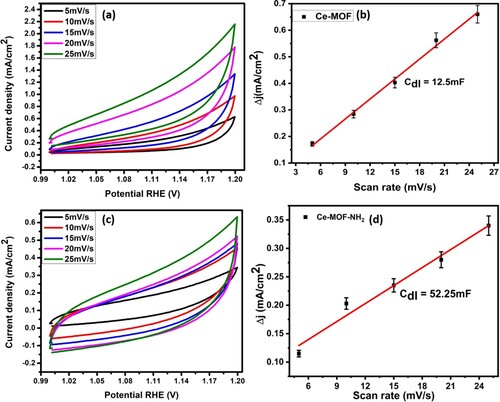
Figure 6. (a) Comparison of 1st and 1000th CV cycle, (b) Chronoamperometry curve of Ce-MOF-NH2/NF, respectively.
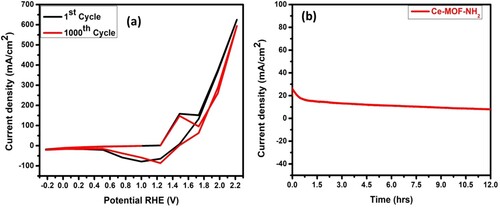
Table 2. Electrochemical performance comparison of Ce-MOF-NH2/NF with other reported materials.