Figures & data
Figure 1. Schematic diagram for the proposed method.
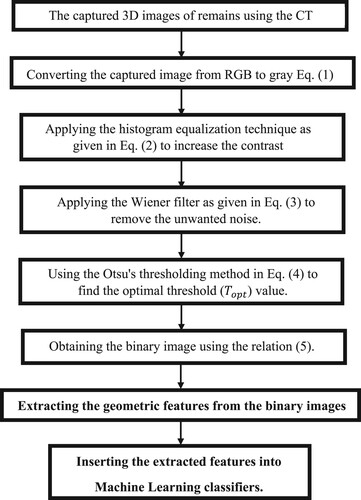
Figure 2. Examples for 3D visualization for the tested remains. (a) Crocodile head, (b) dolphin head and (c) part of hippopotamus-maxilla.
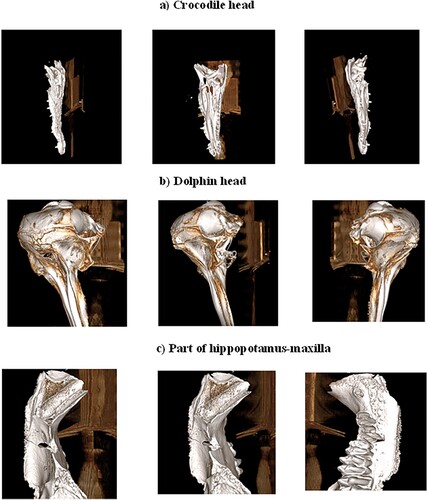
Figure 3. Examples for the recorded 3D image dataset of the crocodile skull.
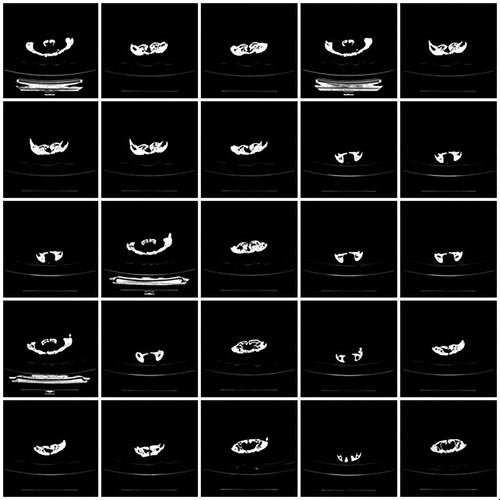
Figure 4. Examples for the recorded 3D image dataset for the dolphin skull.
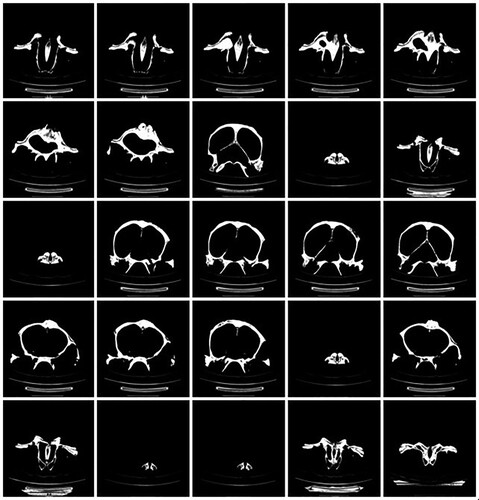
Figure 5. Examples for the recorded 3D image dataset for the hippopotamus maxilla.
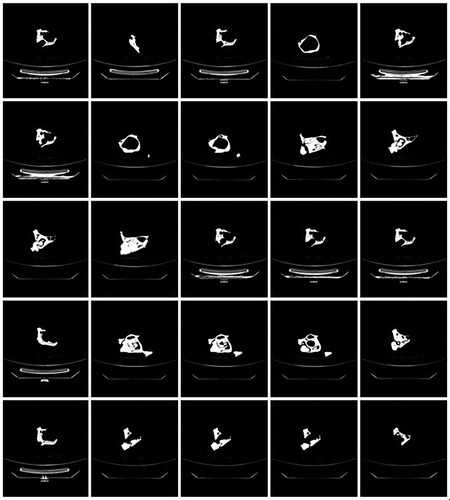
Figure 6. Step-wise visual output for the extraction features.
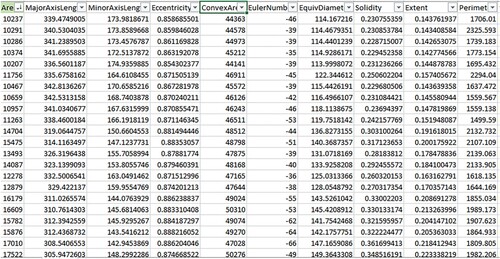
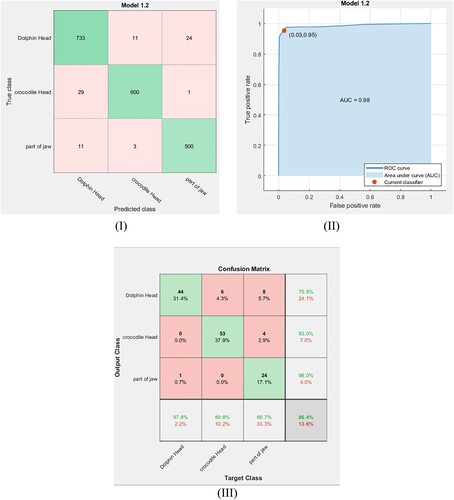
Figure 7. (I) Confusion matrix of the trained data using the quadratic SVM classifier. (II) ROC curve of the trained data point using the quadratic SVM classifier. (III) Confusion matrix of the testing data via the quadratic SVM classifier.
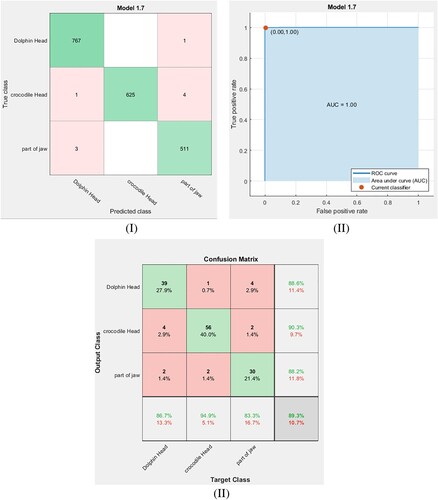
Figure 8. (I) Confusion matrix of the trained data by the cubic SVM classifier. (II) ROC curve for the trained data by the cubic SVM classifier. (III) Confusion matrix of the testing data via the cubic SVM classifier.
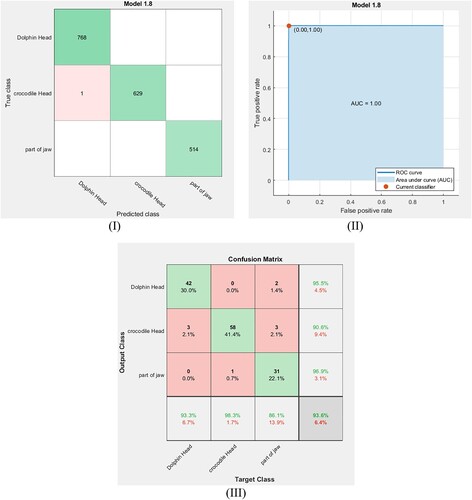
Figure 9. (I) Confusion matrix of the trained data by the fine Gaussian SVM classifier. (II) ROC curve of the trained data by the fine Gaussian SVM classifier. (III) Confusion matrix of the testing data point by the fine Gaussian SVM classifier.
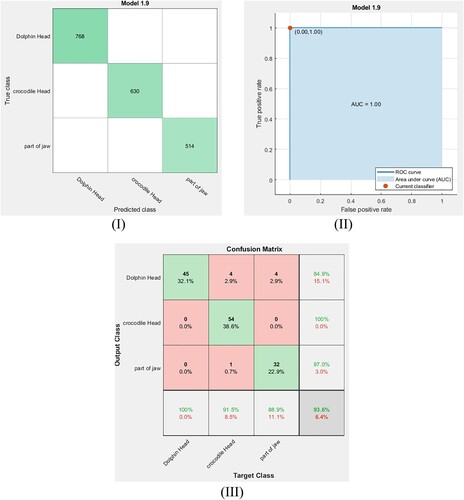
Table 1. Training and testing accuracy rates for each used model with their F1 score and training times.
Figure 10. (I) Confusion matrix of the trained data via the fine KNN classifier. (II) ROC curve of the trained data via the fine KNN classifier. (III) Confusion matrix of the testing data via the fine KNN classifier.
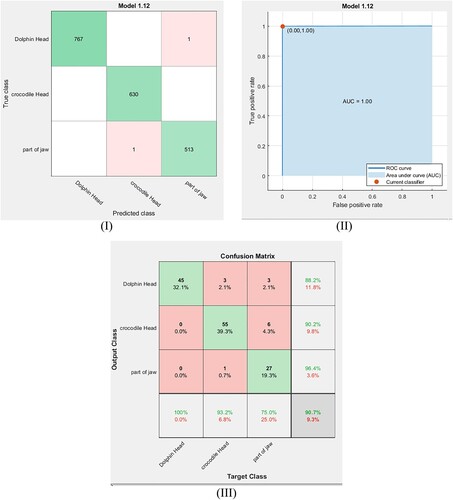
Figure 11. (I): Confusion matrix for the trained data point via the fine DT classifier. (II) ROC curve for the trained data point via the fine DT classifier. (III) Confusion matrix for testing data point via the fine DT classifier.
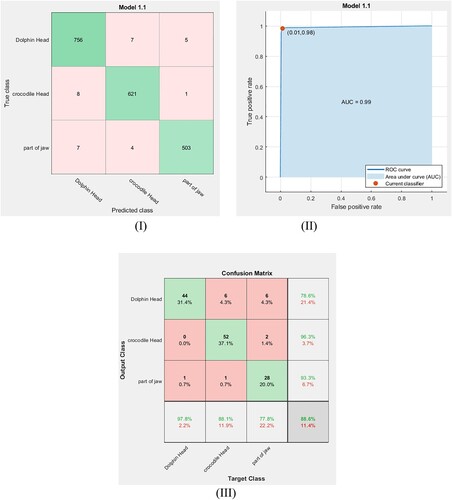
Figure 12. (I) Confusion matrix of the trained data using the medium DT classifier. (II) ROC curve of the trained data using the medium DT classifier. (III) Confusion matrix of the testing data using the medium DT classifier.