
Figures & data
Figure 1. (a) Tumour microenvironment to the breast cancer [Citation26], (b) Flow model containing oxytactic bacteria and nanoparticle with coordinate system, (c) Oxytactic bacteria injected intravenously into human.
![Figure 1. (a) Tumour microenvironment to the breast cancer [Citation26], (b) Flow model containing oxytactic bacteria and nanoparticle with coordinate system, (c) Oxytactic bacteria injected intravenously into human.](/cms/asset/e2801220-8e2b-4b2d-9304-dbd39c09f9b9/tusc_a_2106041_f0001_oc.jpg)
Table 1. Comparison of for different values of
for
,
, and
.
Figure 2. Effect of on velocity profile
.
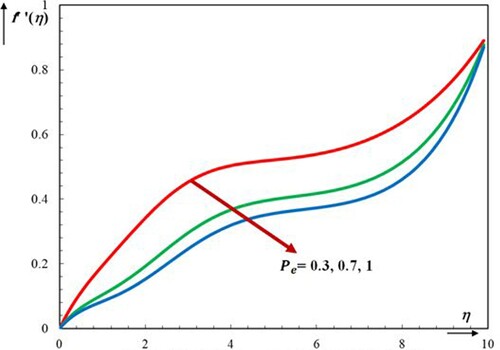
Figure 3. Effect of on temperature profile
.
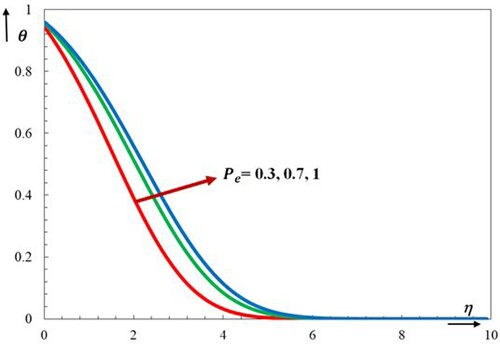
Figure 4. Effect of on motile bacterial density profile
.
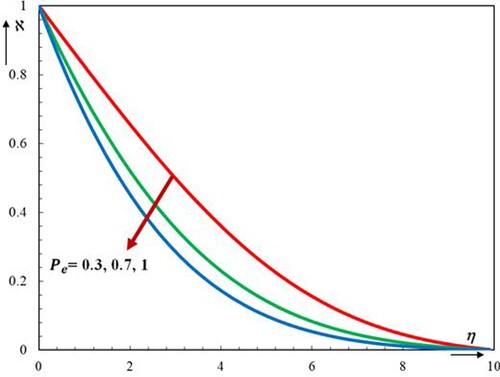
Figure 5. Effect of on oxygen concentrations.
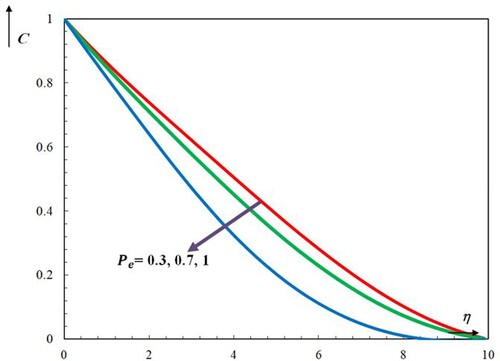
Figure 6. Effect of on mobile bacterial density profile
.
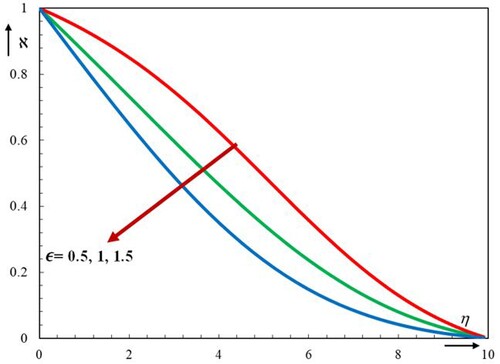
Figure 7. Effect of on oxygen concentration profile
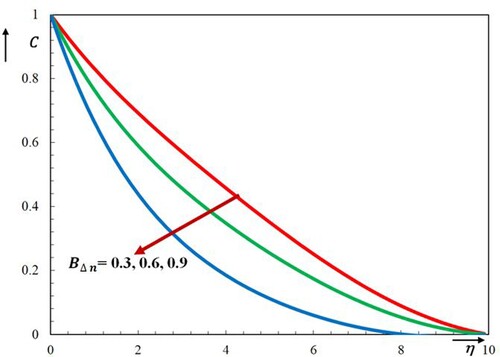
Figure 8. Effect of on velocity profile
.
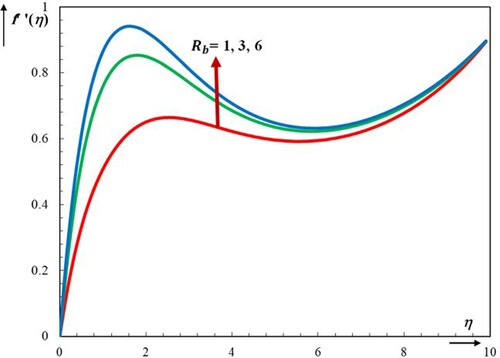
Figure 9. Effect of on velocity profile
.
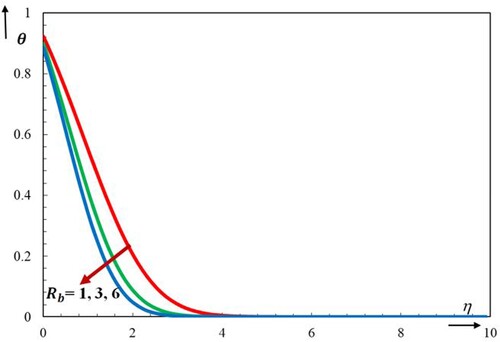
Figure 10. Effect of on motile bacterial density profile
.
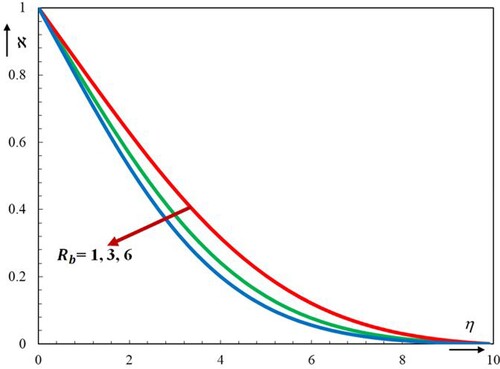
Figure 11. Effect of on oxygen concentration profile
.
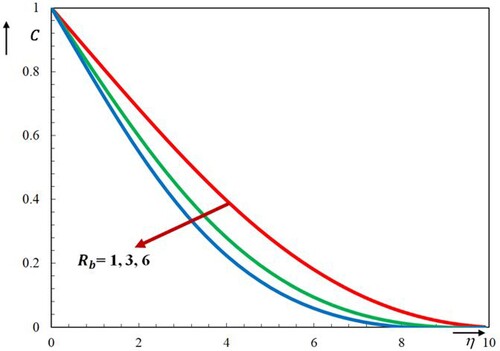
Figure 12. Effect of on temperature profile
.
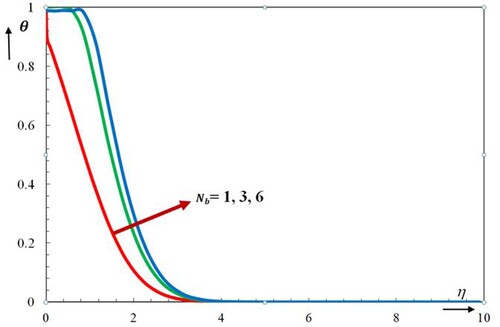
Figure 13. Effect of on temperature profile
.
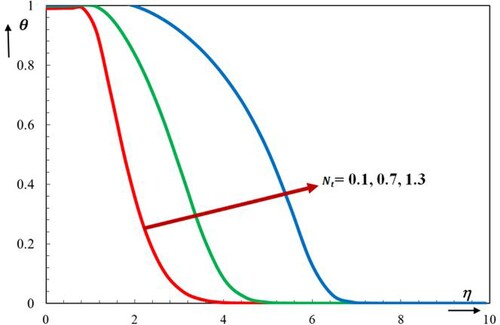
Figure 14. Effect of on motile bacterial density profile
.
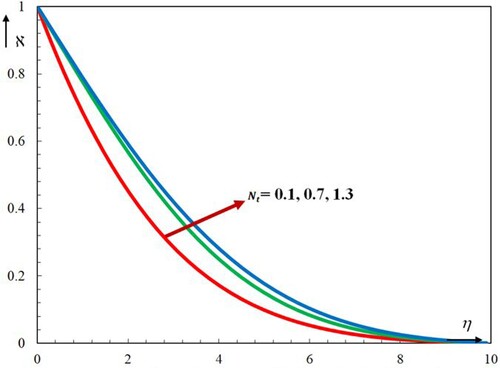
Figure 15. Effect of on oxygen concentration profile
.
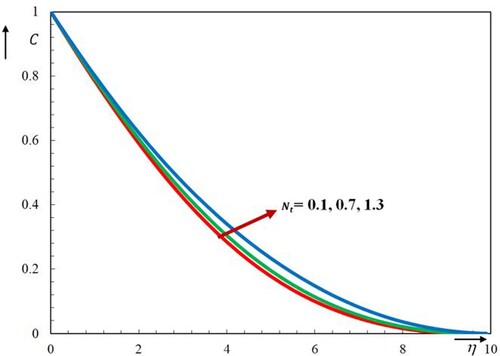
Figure 16. Effect of on velocity profile
.
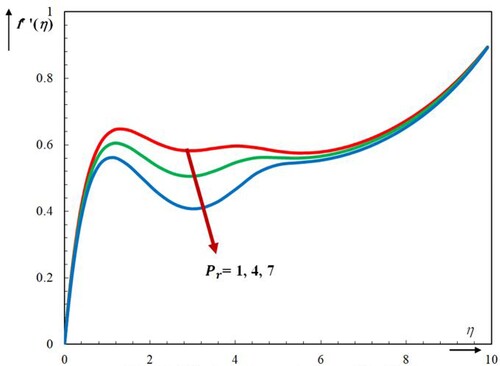
Figure 17. Effect of on motile bacterial density profile
.
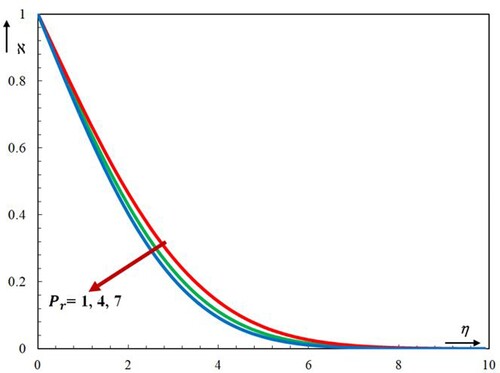
Figure 18. Effect of on velocity profile
.
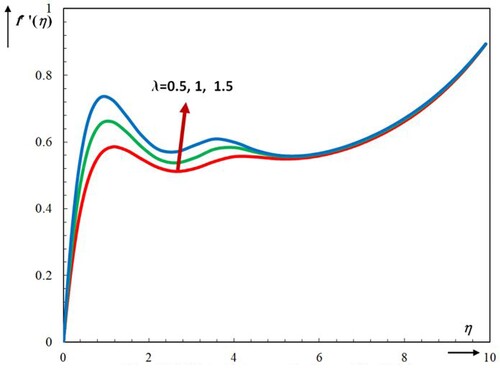
Figure 19. Effect of on motile bacterial density profile
.
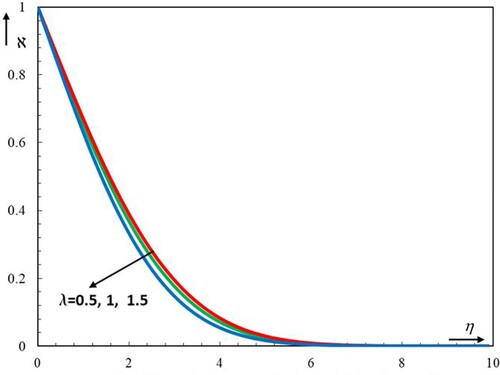
Figure 20. Effect of on motile bacterial density profile
.
Figure 21. Effect of on motile bacterial density profile
.
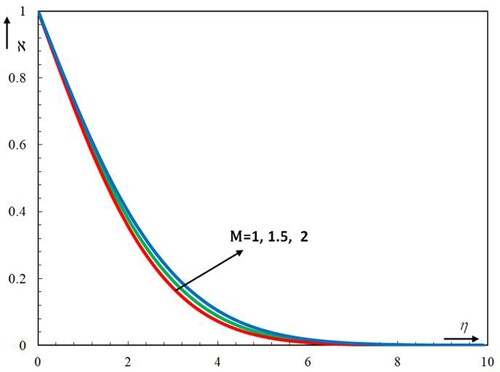
Figure 22. Flow chart for describing the numerical approach.
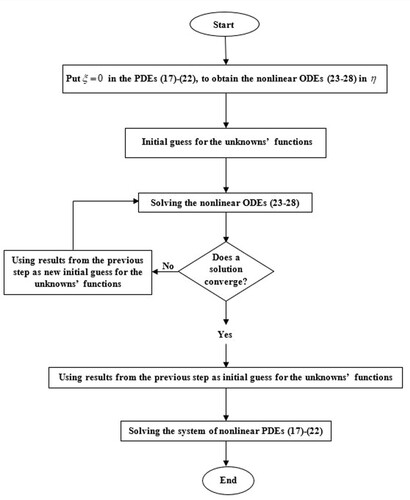
Table 2. Behaviour of ,
,
,
and
for different physical parameter.
Figure 23. Scheme of the integration between experiments and mathematical models [Citation54].
![Figure 23. Scheme of the integration between experiments and mathematical models [Citation54].](/cms/asset/04285837-eff7-4075-8576-07232c2c50d8/tusc_a_2106041_f0023_oc.jpg)
Table