
Figures & data
Table 1. Comprehensive details of each parameter of the nonlinear SIQ system.
Figure 1. Workflow structure of the proposed stochastic structure for the SIQ dynamical model of COVID-19.
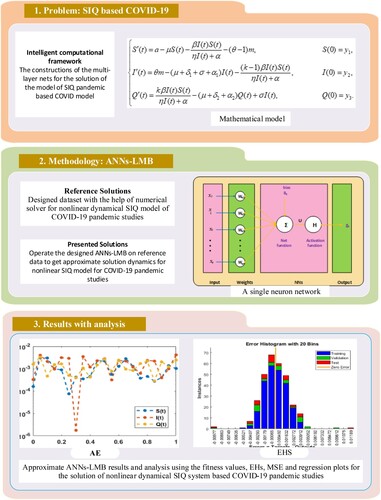
Figure 2. Proposed framework based on the single neuron.
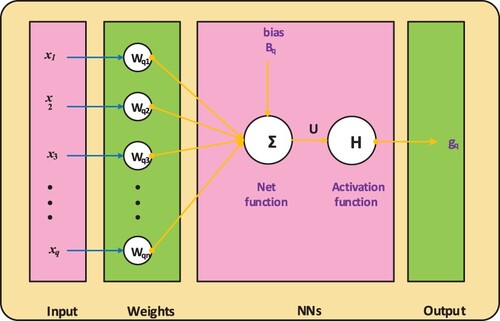
Figure 3. Stochastic structure for the SIQ dynamical COVID-19 model.
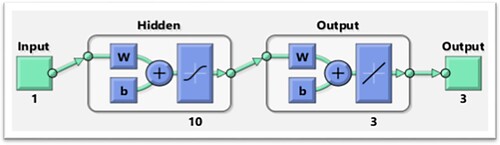
Figure 4. MSE and state transitions for the SIQ dynamical COVID-19 model. (a) Case 1: MSE, (b) Case 2: MSE, (c) Case 3: MSE, (d) Case 1: Values of the state transition, (e) Case 2: Values of the state transition, (f) Values of the state transition.
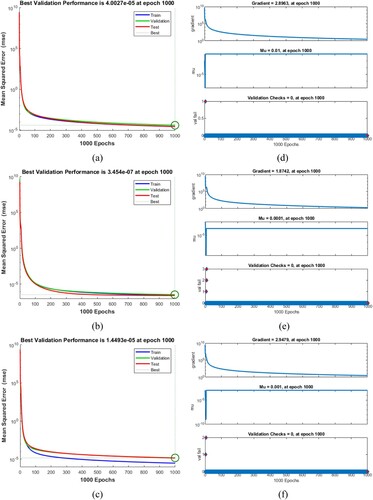
Figure 5. Comparison and EHs values using the ANNs-LMB to solve the SIQ dynamical system based COVID-19. (a) Case 1: Comparison, (b) Case 2: Comparison, (c) Case 3: Comparison, (d) Case 1: EHs, (e) Case 2: EHs, (f) Case 3: EHs.
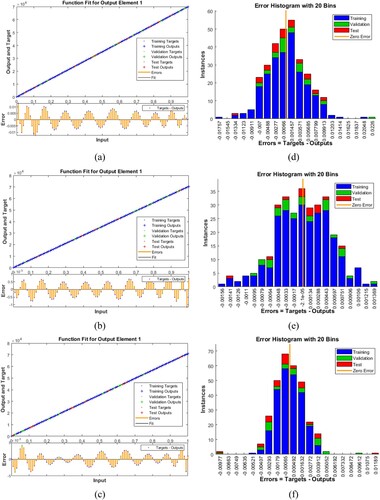
Figure 6. Regression measures through the ANNs-LMB for case 1.
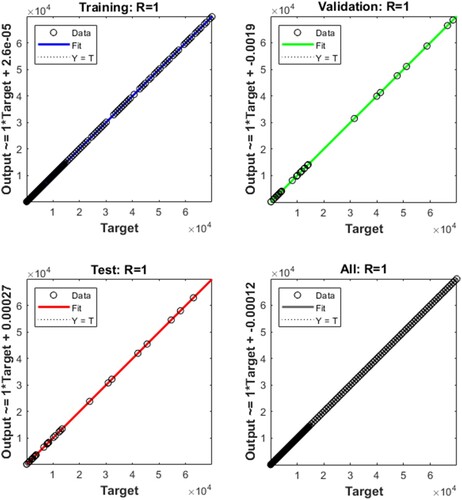
Figure 7. Regression measures through the ANNs-LMB for case 2.
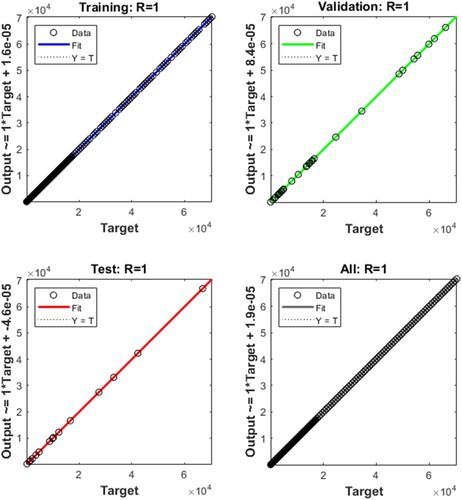
Figure 8. Regression measures through the ANNs-LMB for case 3.
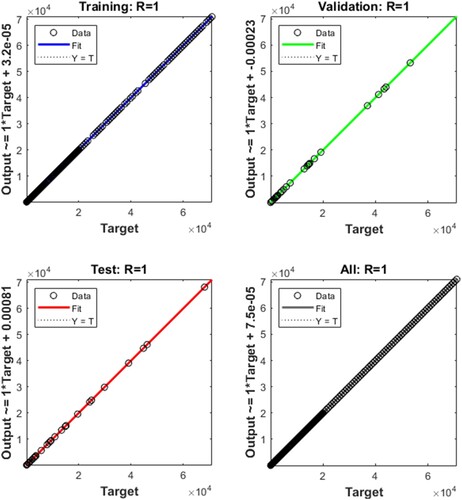
Table 2. Proposed ANNs-LMB for the SIQ dynamical COVID-19 model.
Figure 9. Results comparisons to solve each case of the nonlinear dynamical SIQ-based COVID-19 model. (a) Results for case 1, (b) Results for case 2, (c) Results for case 3.
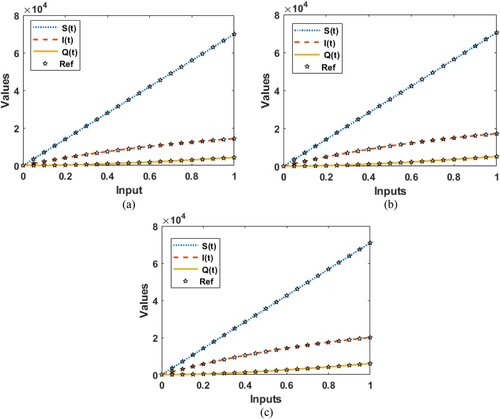
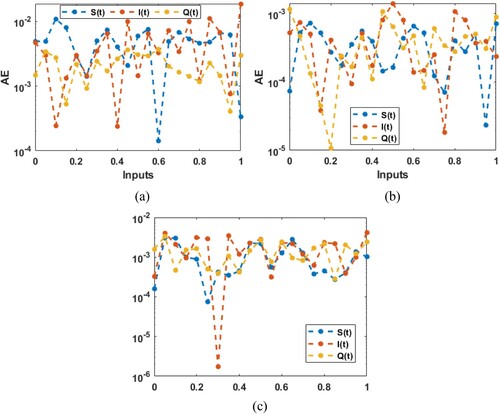
Figure 10. AE for each case of the nonlinear dynamical SIQ-based COVID-19 model, (a) AE: case 1, (b) AE: case 2, (c) AE: case 3.
Data availability statement
All data generated or analyzed during this study are included in this article.