
Figures & data
Figure 1. Infrared spectra of present glasses (x = 0, 5, 10, 20 and 30).
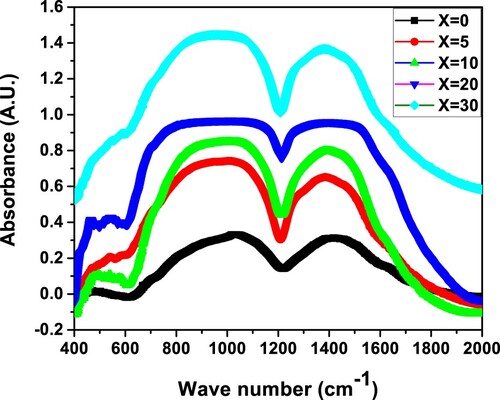
Figure 2. The de-convoluted IR spectra of (30−x)Li2O–xNa2O–40B2O3–30GeO2 glass.
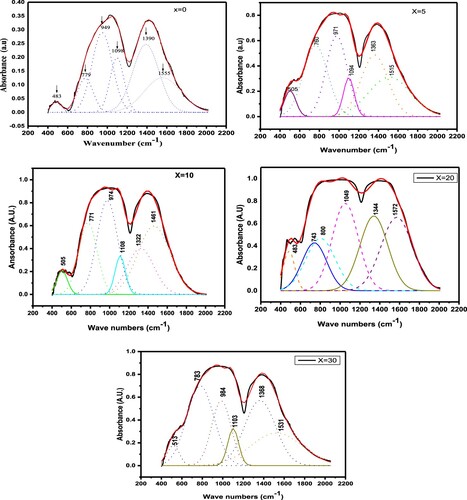
Table 1. Deconvoluted parameters of the FT-IR spectra of the xNa2O–(30−x)Li2O–40B2O3–30GeO2 glasses under study. C is the component band center (cm−1), A is the component band's relative area (percentage) and W is full width at half maxima.
Table 2. Fourier Transform Infrared allocations in (30-x)Li2O–xNa2O–40B2O3–30GeO2 glass network.
Figure 3. The Compositional dependency of several (1110 and 1500 cm−1) IR band peak locations.
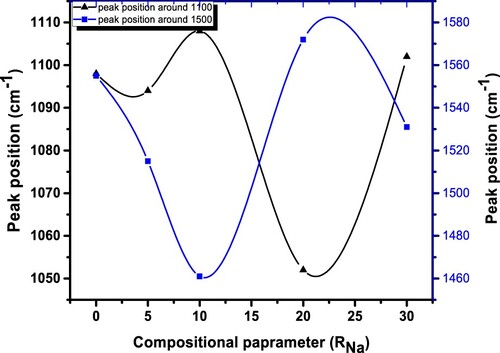
Figure 4. Raman spectra of current glass (30−x)Li2O–xNa2O–40B2O3–30GeO2 with x = 0, 5, 10, 20, 30.
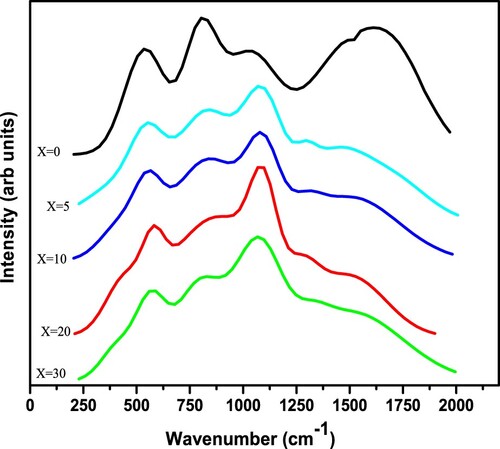
Figure 5. De-convoluted Raman spectra of present glasses using Gaussian functions.
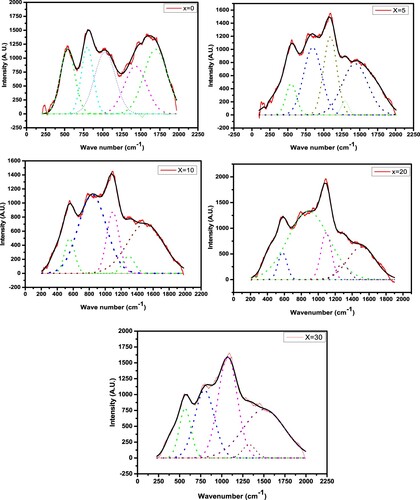
Table 3. Deconvoluted parameters of the Raman spectra of the xNa2O–(30−x)Li2O–40B2O3–30GeO2 glasses under present investigation.
Table 4. Wave numbers and allocations of Raman spectra of (30-x)Li2O–xNa2O–40B2O3–30GeO2 present glasses.
Figure 6. Normalized change of the intensity ratio (I797/I538) between the Raman bands situated at 797 and 538 cm−1, as well as a shifting of the peak of band 538 cm−1 with Na2O content.
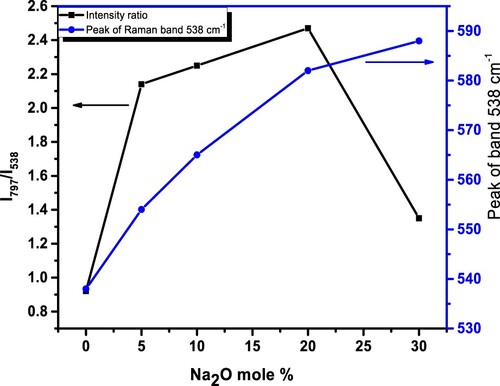
Table 5. Change of relative intensity I797/I538 with Na2O content.