Figures & data
Table 1. Weight and molar percentage of the chemicals used.
Table 2. pH and viscosity of samples a, b, and c.
Figure 1. SEM images of samples a, b, and c.
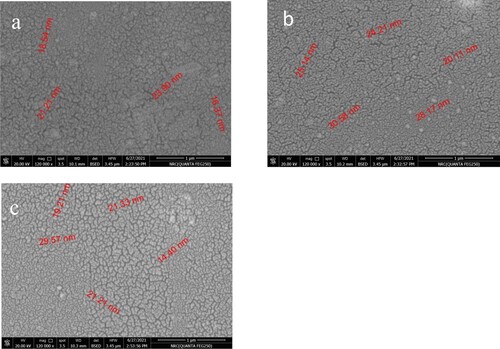
Table 3. Atomic and weight percentage of sample a using EDX measurements.
Table 4. Atomic and weight percentage of sample a using EDX measurements.
Table 5. Atomic and weight percentage of sample a using EDX measurements.
Figure 2. Spectroscopic transmittance of samples a, b, and c.
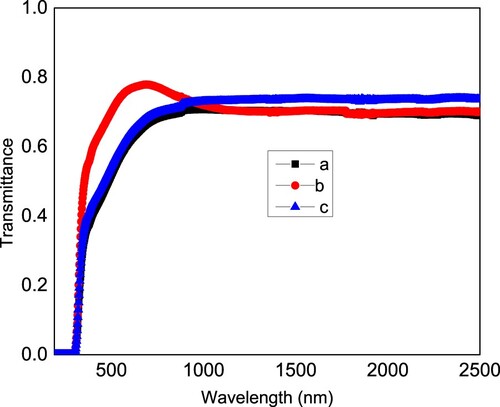
Figure 3. Spectroscopic reflectance of samples a, b, and c.
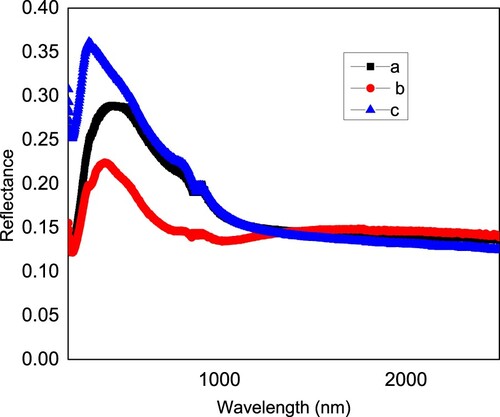
Figure 4. Extinction coefficient k (a) and refractive index versus wavelength (b) for samples a, b, and c.
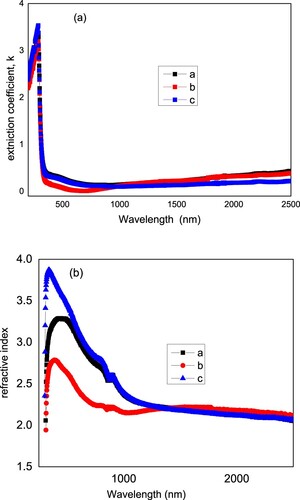
Figure 5. Figure of merit as a function of wavelength for samples a, b, and c.
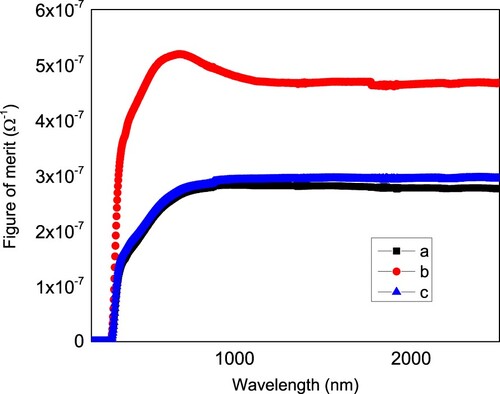
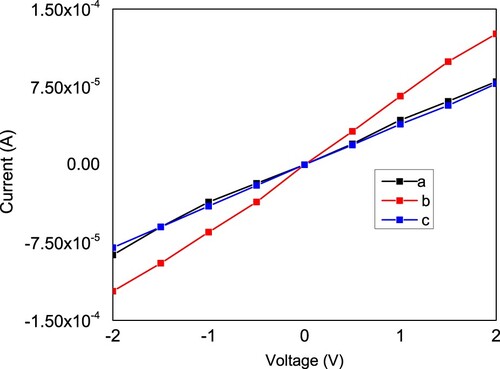
Figure 6. Current–voltage curves for samples a, b, and c.