Figures & data
Figure 1. Histograms of posterior parameters.
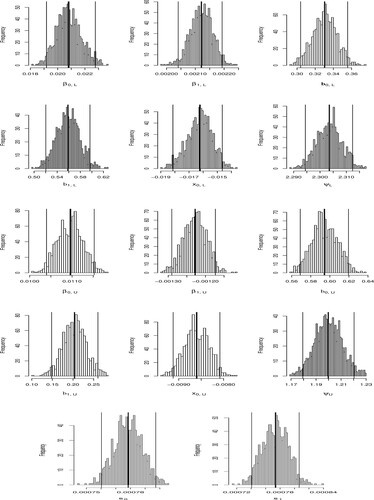
Figure 2. Deviation and model fit for different radius manufactured cylinders assuming logistic errors. (a) Radius , (b) radius
and (c) radius
.
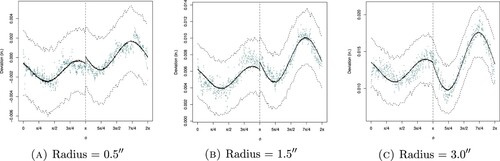
Figure 3. Deviation and model fit for three manufactured cylinders assuming Laplace errors. (a) Radius , (b) radius
and (c) radius
.
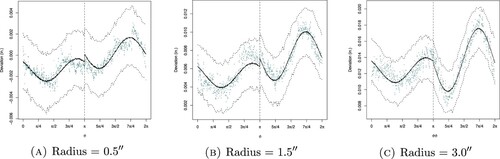
Figure 4. Deviation and model fit for three manufactured cylinders assuming Cauchy distributed errors. (a) Radius , (b) radius
, (c) radius
, (d) radius
, (e) radius
and (f) radius
.
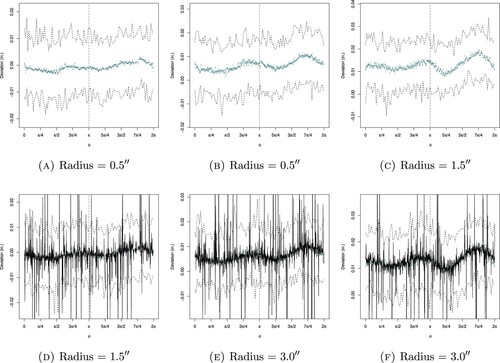
Figure 5. Deviation and model fit for three manufactured cylinders assuming exponentially distributed errors. (a) Radius , (b) radius
and (c) radius
.
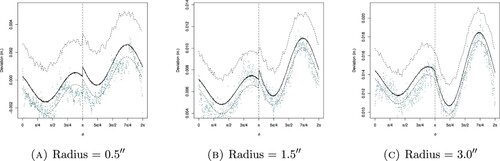
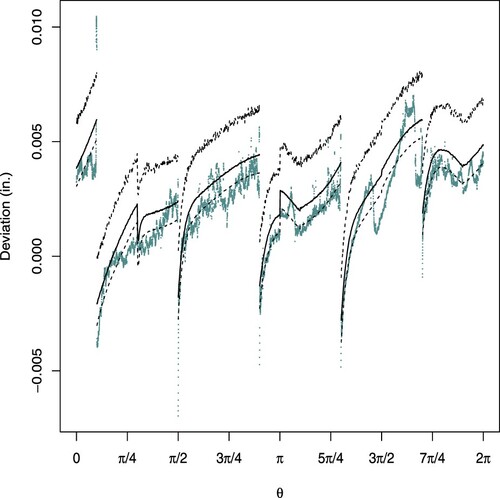
Figure 6. Deviation and model fit for three manufactured cylinders.
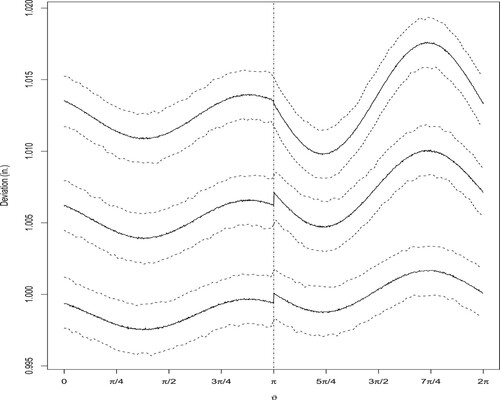
Figure 7. Histograms of posterior draws for five-sided polygon.
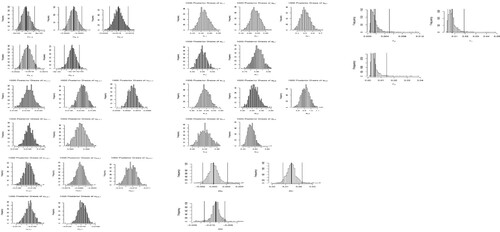
Figure 8. Deviation profile and model fit of a new regular five-sided polygon (pentagon) of size assuming logistic error. (a) Deviation profile assuming l Logistic error and (b) deviation and model fit assuming logistic error.
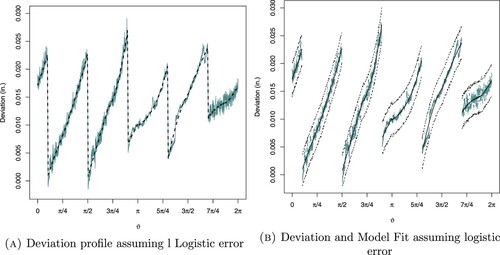
Figure 9. Deviation profile and model fit of a new regular five-sided polygon (pentagon) of size assuming Laplace error. (a) Deviation profile assuming Laplace error and (b) deviation and model fit assuming Laplace error.
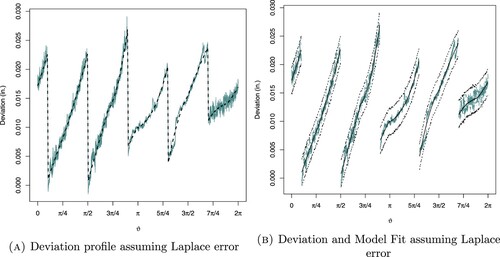
Figure 10. Deviation and model fit of the new regular Pentagon assuming Cauchy distribution for error. (a) Deviation profile assuming Cauchy error, (b) deviation and model fit assuming Cauchy error and (c) deviation and model fit assuming Cauchy error.
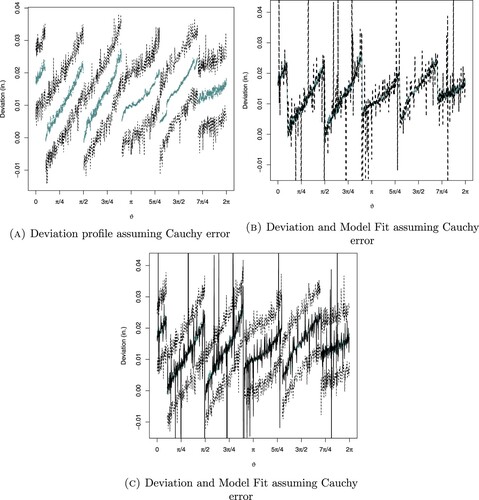
Figure 11. Deviation profile and model fit of the new regular Pentagon using exponential distribution. (a) Deviation profile of a new
Pentagon using exponential distribution and (b) deviation and model fit of the new
regular Pentagon using exponential distribution.
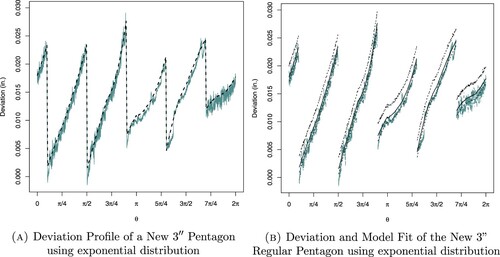
Figure 12. Deviation profile and model fit of the new regular Pentagon assuming Lognormal errors. (a) Deviation profile and (b) deviation and model fit.
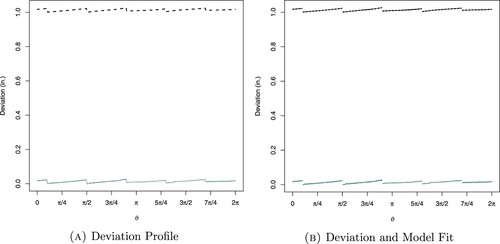
Figure 13. Histograms of posterior parameters for the irregular octagon.
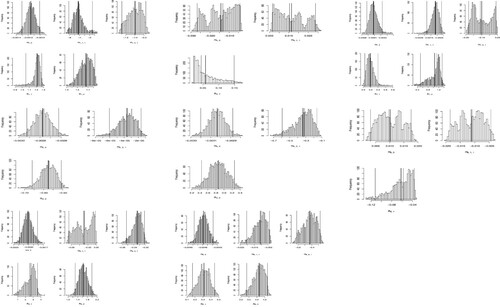
Figure 14. Deviation and model fit for new irregular octagon assuming logistic errors. (a) Deviation profile and (b) deviation and model fit.
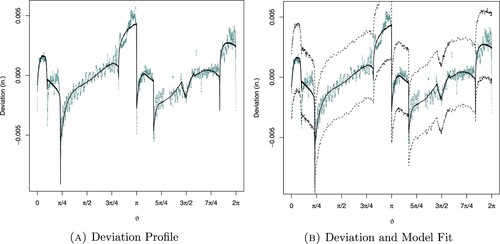
Figure 15. Deviation and model fit for new irregular octagon. (a) Deviation profile and (b) deviation model fit.
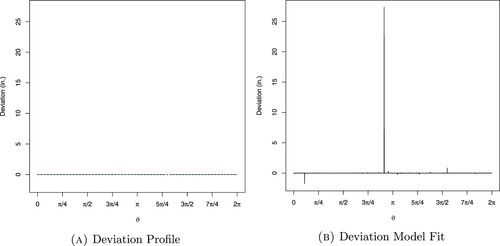
Figure 16. Deviation profile and model fit assuming exponential distribution for errors. (a) Deviation profile and (b) deviation and model fit.
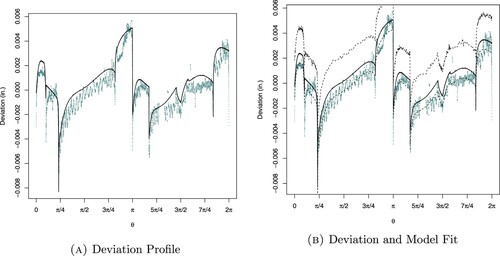
Figure 17. Histograms of posterior draws for free-form shapes.
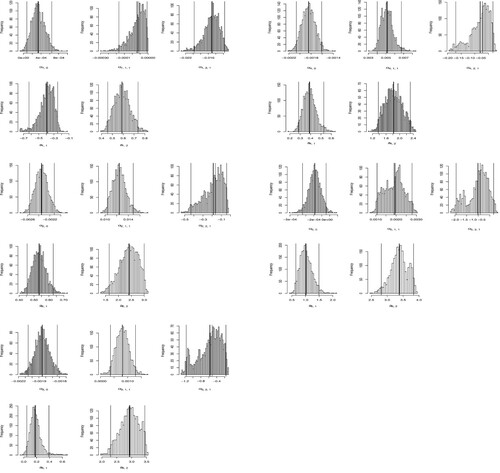
Figure 18. Deviation and model fit of the freestyle shape using logistic errors.
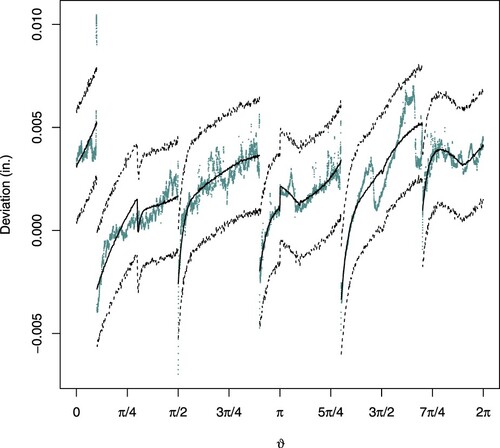
Figure 19. Deviation and model fit for the new freestyle shape using Cauchy Errors. (a) Deviation with posterior predictive Intervals, (b) deviations and posterior predictive means and (c) deviations with posterior predictive means and intervals.
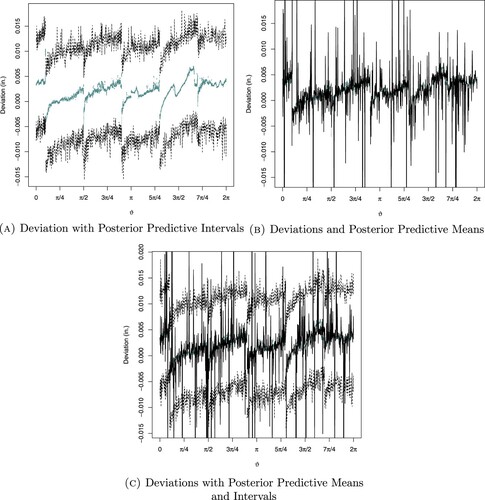
Figure 20. Deviation and model fit for free-form shape assuming exponential errors.